


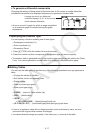
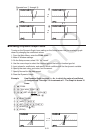

5-21
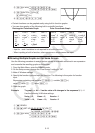
Repeats from through .
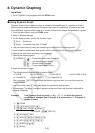
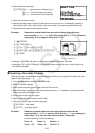
I Drawing a Dynamic Graph Locus
Turning on the Dynamic Graph locus setting on the Setup screen lets you overlay a graph
drawn by changing the coefficient values.
1. From the Main Menu, enter the DYNA mode.
2. Make V-Window settings.
3. On the Setup screen, select “On” for “Locus”.
4. Use the cursor keys to select the function type on the built-in function type list.
5. Input values for coefficients, and specify which coefficient will be the dynamic variable.
6. Specify the start value, end value, and increment.
7. Specify Normal for the draw speed.
8. Draw the Dynamic Graph.
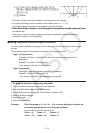
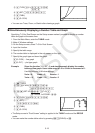
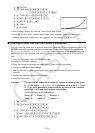
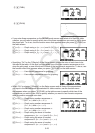
Example Use Dynamic Graph to graph
y = Ax, in which the value of coefficient
A changes from 1 through 4 in increments of 1. The Graph is drawn 10
times.
K DYNA
(V-WIN)(INIT))
K(SET UP)_AA*(On))_
*fx-9750G
ɉ: A
(B-IN)(SEL)
(VAR)@U?U
(SET)@UCU@U)
(SPEED)( ))
(DYNA)
1
4
2
3
1
4
2
3
····
····
····
····