


5-33
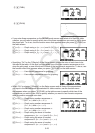
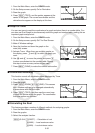
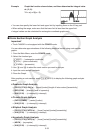
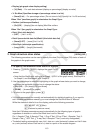
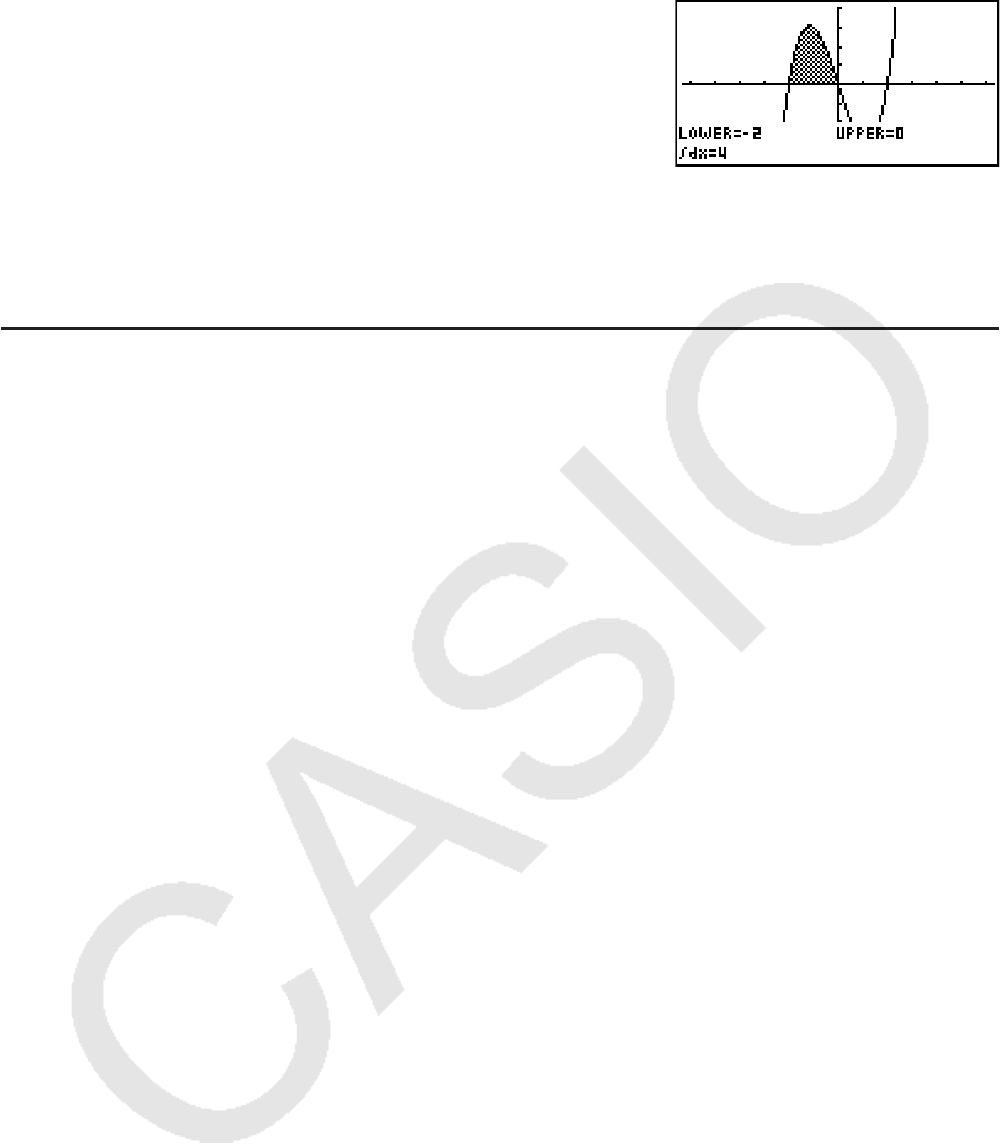
Example Graph the function shown below, and then determine the integral value
at (–2, 0).
Y1 =
x(x + 2)(x – 2)
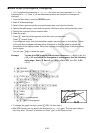
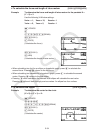
• You can also specify the lower limit and upper limit by inputting them on the 10-key pad.
• When setting the range, make sure that the lower limit is less than the upper limit.
• Integral values can be calculated for rectangular coordinate graphs only.
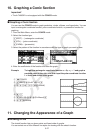
I Conic Section Graph Analysis
Important!
• The fx-7400Gɉ is not equipped with the CONICS mode.
You can determine approximations of the following analytical results using conic section
graphs.
1. From the Main Menu, enter the CONICS mode.
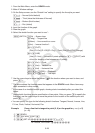
2. Select the function type.
(RECT).... {rectangular coordinate}
(POL).... {polar coordinate}
(PARM).... {parametric}
3. Use D and A to select the conic section you want to analyze.
4. Input the conic section constants.
5. Draw the Graph.
After graphing a conic section, press (G-SLV) to display the following graph analysis
menus.
S Parabolic Graph Analysis
•{FOCS}/{VTX}/{LEN}/{e} ... {focus}/{vertex}/{length of latus rectum}/{eccentricity}
•{DIR}/{SYM} ... {directrix}/{axis of symmetry}
•{X-IN}/{Y-IN} ... {
x-intercept}/{y-intercept}
S Circular Graph Analysis
•{CNTR}/{RADS} ... {center}/{radius}
•{X-IN}/{Y-IN} ... {
x-intercept}/{y-intercept}
S Elliptical Graph Analysis
•{FOCS}/{VTX}/{CNTR}/{e} ... {focus}/{vertex}/{center}/{eccentricity}
•{X-IN}/{Y-IN} ... {
x-intercept}/{y-intercept}
S Hyperbolic Graph Analysis
•{FOCS}/{VTX}/{CNTR}/{e} ... {focus}/{vertex}/{center}/{eccentricity}
•{ASYM} ... {asymptote}
•{X-IN}/{Y-IN} ... {
x-intercept}/{y-intercept}