


5-15
K RUN
•
MAT (or RUN)
?(Y)(=)T
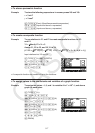
G(CLIP)BBB(COPY)
KGRAPH
K(SET UP)_AAAA*(Off))
*fx-7400G
ɉ, fx-9750Gɉ: AAA
(V-WIN)DUDUAUA
@?U@?UDU)
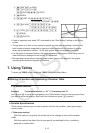
(TYPE)(Y=)ATVBTCU
(DRAW)
H(PASTE)
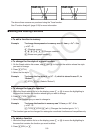
• Paste is supported only when “Off” is selected for the “Dual Screen” setting on the Setup
screen.
• Though there is no limit on the number of graphs you can draw by pasting a function, the
total number of graphs supported by trace and other functions is 30 (number of graphs
drawn using expression number 1 to 20, plus graphs drawn using pasted functions).
• For the graph of a pasted function, the graph expression that appears when using trace or
other functions is displayed in the format: Y= expression.
• Re-executing a draw without clearing graph screen memory will redraw all the graphs,
including those produced by pasting functions.
7. Using Tables
To enter the TABLE mode, select the TABLE icon on the Main Menu.
I Storing a Function and Generating a Number Table
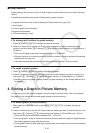
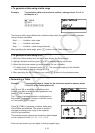
S To store a function
Example To store the function y = 3x
2
– 2 in memory area Y1
Use D and A to move the highlighting in the Table relation list to the memory area where
you want to store the function. Next, input the function and press U to store it.
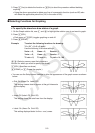
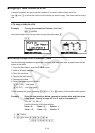
S Variable Specifications
There are two methods you can use to specify value for the variable x when generating a
numeric table.
• Table range method
With this method, you specify the conditions for the change in value of the variable.
• List
With this method, the data in the list you specify is substituted for the
x-variable to
generate a number table.