Local Monitoring Systems
6
3.6 Logging
• Alarm history log: The Advanced Microprocessor displays the 10 most recent alarms. The
Advanced Microprocessor with Graphics displays the most recent 60 alarms. Both provide a time
and date stamp for each event
• Run time log: Displays run time and hours for major components (also allows reset of run hours)
including compressors, GLYCOOL, fan, humidifier, and reheat.
3.7 Alarms
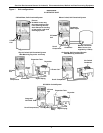
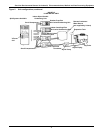
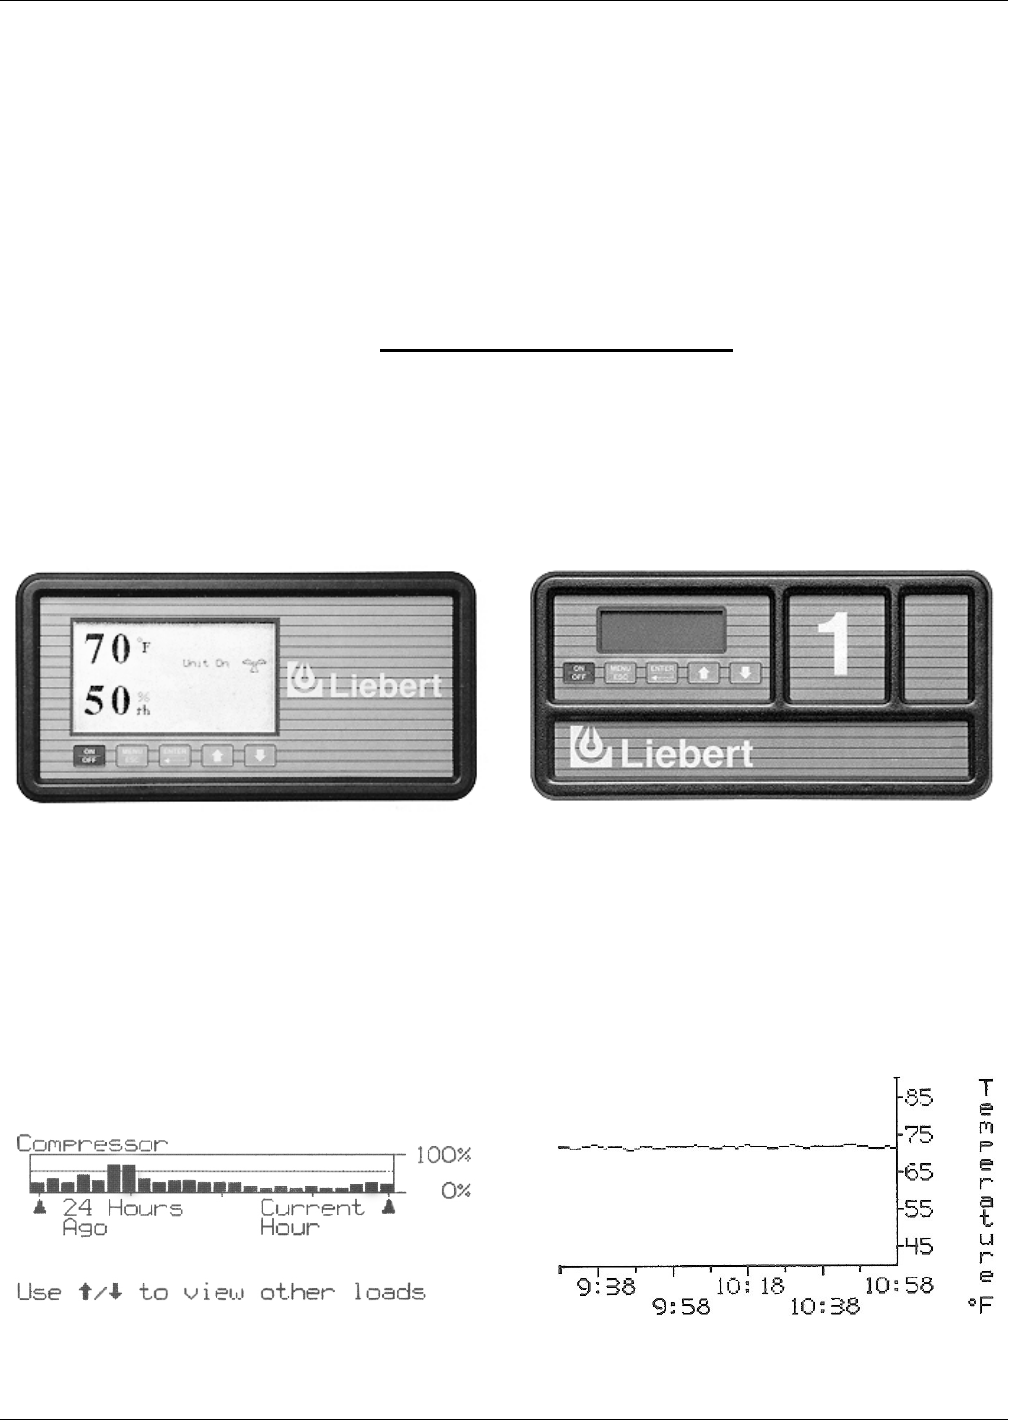
Figure 3 Microprocessor control systems
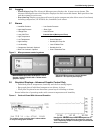
3.8 Graphical Displays—Advanced Graphic Control Only
• Individual plots of temperature, humidity and the four analog inputs.
• Bar graph plots of individual component run history by hour.
• Floor plan of optional water detection system layout including on alarm.
Status indication of operating modes with current temperature and humidity.
Figure 4 Optional Views With Advanced Graphics
• Humidifier Problem • Low Suction Pressure
• High Head Pressure • Short Cycle
• Change Filter • Loss Of Power
• Loss of Air Flow Custom Alarm (Maximum of Four)
• High Temperature • Water Under Floor
• Low Temperature • Smoke Detected
• High Humidity • Standby GC Pump On
• Low Humidity • Loss Of Water Flow
• Compressor Overload—Optional • Standby Unit On
• Main Fan Overload—Optional • User-Customized Text
Advanced Microprocessor w/Graphics Control
System—Optional. Backlit 240 x 128 dot matrix
graphics display.
Advanced Microprocessor Control System.
Backlit 4 x 20 Liquid Crystal Display.
The runtime screen provides data in either tabular
or easy-to-read graphic formats.
Histograms–historical depictions–of temperature or
humidity can be displayed on the screen for analysis.
This is especially helpful in tracking the environmental
factors of an alarm.


