2640A/2645A NetDAQ
Users Manual
5-20
ds136s.bmp
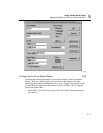
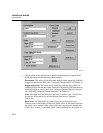
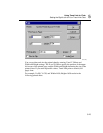
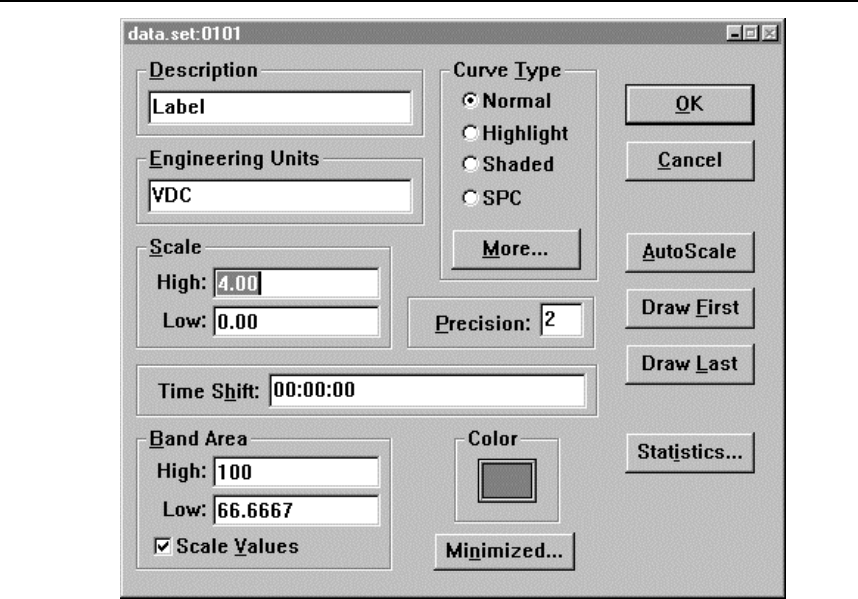
3. The tag name of the selected curve appears in the dialog box caption. Each
dialog box entry has the following characteristics:
Description This entry will be initialized with the string entered in NetDAQ
Logger for the channel label. (See "Assigning Channel Labels" in Chapter 3.)
Engineering Units This entry will be initialized with the string entered in
NetDAQ Logger for the units label. Enter the Engineering Units characters in
NetDAQ Logger as a units label. (See "Selecting Analog Channel Functions"
and "Selecting Computed Channel Functions" in Chapter 3.)
Scale The High and Low entries set the curve’s vertical scale. (Trend Link
ignores the Scale entries if you have checked Preferences | Dynamic
AutoScale.)
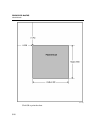
Band Area The High and Low entries define the portion of the curve
window used for the display of the curve. Band values of 100 and 0 represent
the whole curve window, while values of 50 and 0 represent the bottom half
of the curve window. If you check Scale Values, the band bars displayed on


