


11–4 Statistical Operations
File name 33s-English-Manual-040130-Publication(Edition 2).doc Page : 388
Printed Date : 2004/1/30 Size : 13.7 x 21.2 cm
Statistical Calculations
Once you have entered your data, you can use the functions in the statistics menus.
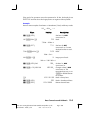
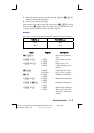
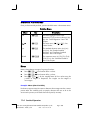
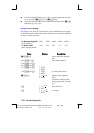
Statistics Menus
Menu Key Description
L.R.
º
%
The linear–regression menu: linear
estimation {
ˆ
} {
ˆ
} and curve–fitting {
} {
}
{
}. See ''Linear Regression'' later in this
chapter.
x
,
y
º
(
The mean menu: {
} {
} {
}. See
"Mean" below.
s,
σ
º
+
The standard–deviation menu: {
} {
}
{
σ
} {
σ
}. See "Sample Standard
Deviation" and "Population Standard
Deviation" later in this chapter.
SUMS
º
.
The summation menu: {
} {
} {
} {
}
{
} {
}. See "Summation Statistics"
later in this chapter.
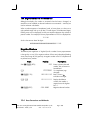
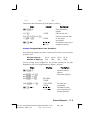
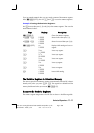
Mean
Mean is the arithmetic average of a group of numbers.
Press
º
(
{
} for the mean of the x–values.
Press
º
(
{
} for the mean of the y–values.
Press
º
(
{
} for the weighted mean of the x–values using the
y–values as weights or frequencies. The weights can be integers or
non–integers.
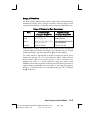
Example: Mean (One Variable).
Production supervisor May Kitt wants to determine the average time that a certain
process takes. She randomly picks six people, observes each one as he or she
carries out the process, and records the time required (in minutes):