


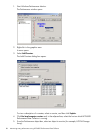
6. Click All counters, or select counters to view.
7. Click All instances, or select instances to view.
8. Click Add to add the counters to the window.
The utility begins displaying the performance metrics of the selected object.
9. To add other objects, repeat the steps. To remove metrics, select the metric from the list and
click the remove icon, which appears as an X.
10. To close the utility, click Close.
Data filtering
You can limit the amount of data that is collected and presented, which can be useful if your
configuration includes numerous arrays, physical disks, and virtual disks. Windows Performance
Monitor uses the evapmfilt.conf file, which contains the names of the virtual disks and arrays
for which you want to retrieve data. Use the HP P6000 Performance Data Collector command line
interface to create or update the evapmfilt.conf file.
Configure filtering
To configure filtering for Windows Performance Monitor:
1. Stop Windows Performance Monitor.
2. Open the command line interface.
3. To filter data for specific arrays, enter the following command with the array names:
pfa [array]*
This creates the evapmfilt.conf file.
4. To filter data for specific virtual disks, enter the following command with the virtual disk names:
pfvd [vdisk]*
You can use friendly names in these commands.
5. When filtering configuration is complete, restart Windows Performance Monitor. When you
click Add counters in a new Windows Performance Monitor session, the evapmfilt.conf
file is detected and data is filtered accordingly. Until you turn filtering off, the filters you
configure remain active in successive sessions. (A message indicates that filtering is active.)
To make changes, follow the same procedure and use the same commands to update the virtual
disk or array names.
To stop filtering:
1. Stop Windows Performance Monitor.
2. Open the command line interface.
3. Enter the following command:
pfd
4. Restart Windows Performance Monitor.
Objects and counters
Use the objects and counters in Windows Performance Monitor to gather performance metrics.
Objects are the items you can monitor, such as virtual disks, hosts, and controllers. The counters
characterize the workload and performance for each object.
Using the graphical user interface 87