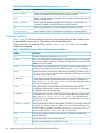
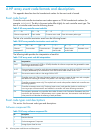
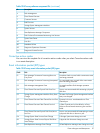
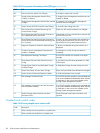
The counters are:
• Average Drive Queue Depth—The average number of all active requests to each disk
in the disk group, over all the disks in the disk group.
• Average Drive Latency—The average time between when a data transfer command is
sent to a disk and when command completion is returned from the disk. The time is not
separated into read and write latencies. Completion of a disk command does not necessarily
imply host request completion, because the request to a specific physical disk might be only
a part of a larger request operation to a virtual disk.
On the HSV100 series of controllers, only average latency (the average of read and write
latencies) is reported. From the HSV200 series of controllers onwards, separate metrics are
provided for read and write latency.
• Average Read Req/s—The number of read requests (per second) sent to physical disks.
• Average Read MB/s—The rate at which data is read (per second) from physical disk.
• Average Read Latency—The average time it takes for a disk to complete a read request.
This average is weighted by requests per second (HSV200 controller series onwards).
• Average Write Req/s—The number of write requests (per second) sent to physical disks.
• Average Write MB/s—The amount of data written (per second) to physical disks.
• Average Write Latency—The average time it takes for a disk to complete a write request.
This average is weighted by requests per second (HSV200 controller series onwards).
HP EVA DR tunnels
The HP EVA DR tunnels object reports the intensity and behavior of the link traffic between source
and destination arrays. The counters for this object display information only if there is at least one
active DR group on the array; otherwise, only the header appears. You can display metrics in
either MBs or KBs. Creation and management of DR groups is not supported by HP P6000
Command View array-based management.
Although some arrays allow up to four open tunnels on a host port, only one tunnel is active for a
single DR group. Multiple DR groups can share the same tunnel. Statistics for each tunnel are
reported by both the source and destination arrays, but the directional counters are complementary.
The port names are displayed as FP1 and FP2 for the HSV100, HSV110, HSV200, and HSV300
controller series, and as FP1, FP2, FP3, and FP4 for the HSV210 and HSV340 series onwards.
The counters are:
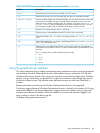
• Round Trip Delay—The average time, in milliseconds, for a signal (ping) to travel from
the source to the destination and back. In replication traffic, the signal is queued behind data
transmissions, which increases the round trip delay. If the destination controller is busy, the
value also increases. Round trip delay is reported for all active tunnels.
• Copy Retries—The number of copies from the source array that were retransmitted due to
a failed copy transmission. Each retry creates a 128-KB copy. Retries are reported by both
the source and destination arrays.
• Write Retries—The number of writes from the source array that were retransmitted due
to a failed write to the destination array. Each retry creates an 8-KB copy. If the write contains
multiple 8–KB segments, only the failed segments are retransmitted. Retries are reported by
both the source and destination arrays.
• Copy In MB/s—The rate at which data is copied to an array to populate the members of
a DR group with data when an initial copy or full copy is requested.
• Copy Out MB/s—The rate at which data is copied from an array to populate the members
of a DR group with data when an initial copy or full copy is requested.
92 Monitoring array performance using HP P6000 Performance Data Collector


