


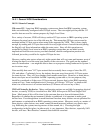
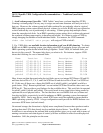
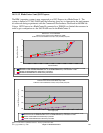
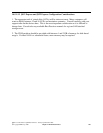
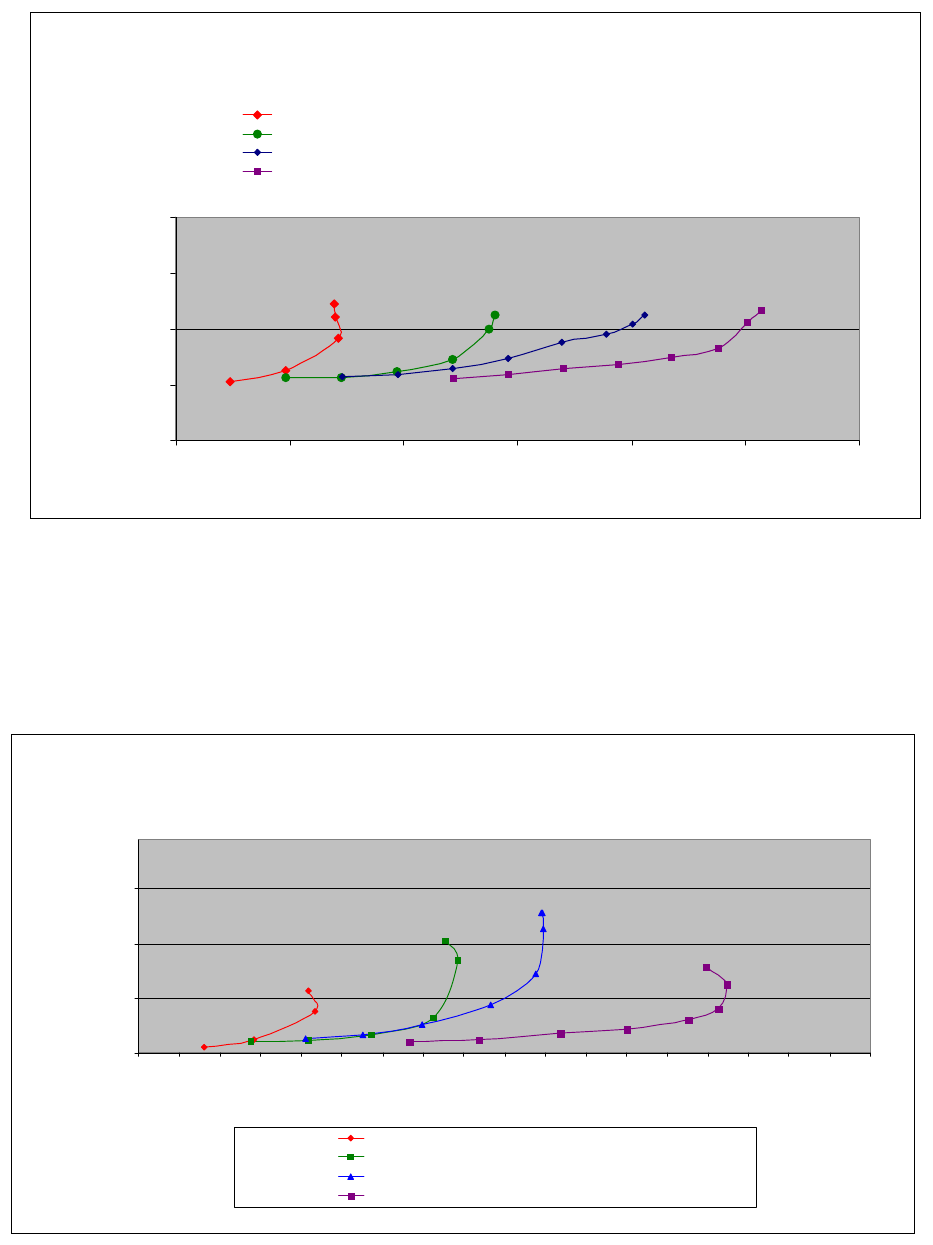
The chart above shows some basic performance scaling for 1, 2, 3 and 4 processors. For this
comparison both partition measurements were done with the processors set up as shared, and
with the IBM i operating system partition set to capped. The rest of the resources stay constant,
which consists of 90 RAID1 DDMs in a DS4800 under 16 LUNs 2 GB of memory assigned to
VIOS and 28 GB assigned to the IBM i operating system partition. Note that only 1 LPAR is
running at the time of the experiment.
IBM i 6.1 Performance Capabilities Reference - January/April/October 2008
© Copyright IBM Corp. 2008 Chapter 14 DASD Performance 223
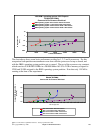
VIOS/IBM i operating system JS22 Express
DS4800 (90 DDMs)
Commercial Performance Workload
0.001
0.01
0.1
1
10
0 10000 20000 30000 40000 50000 60000
Transactions/Minute
Response Time
(sec)
IBM i operating system .8 Processor VIOS .2 Processor
IBM i operating system 1.7 Processor VIOS .3 Processor
IBM i operating system 2.6 Processors VIOS .4 Processors
IBM i operating system 3.5 Processors VIOS .5 Processors
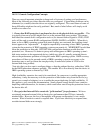
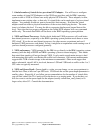
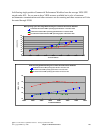
VIOS/IBM i operating system JS22 Blade
DS4800 (90 DDMs)
Commercial Performance Workload
0.001
0.011
0.021
0.031
0 500 1000 1500 2000 2500 3000 3500 4000 4500 5000 5500 6000 6500 7000 7500 8000 8500 9000
ASP Throughput OP/S
Average DASD Response Time
(Seconds)
i5OS .8 Processor VIOS .2 Processor
i5OS 1.7 Processor VIOS .3 Processor
i5OS 2.6 Processors VIOS .4 Processors
i5OS 3.5 Processors VIOS .5 Processors