18.4 LPAR Measurements
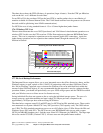
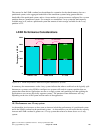
The following chart shows measurements taken on a partitioned 12-way system with the system’s CPU
utilized at 70 percent capacity. The system was at the V4R4M0 release level.
Note that the standalone 12-way CPW value of 4700 in our measurement is higher than the published
V4R3M0 CPW value of 4550. This is because there was a contention point that existed in the CPW
workload when the workload was run on large systems. This contention point was relieved in V4R4M0
and this allowed the CPW value to be improved and be more representative of a customer workload when
the workload is run on large systems.
9 %17501770177013%52904700(3) 4-ways
9 %n/a253526059%51404700(2) 6-ways
10 %n/a169033307%502047008-way, 4-way
SecondarySecondaryPrimary
Average
LPAR
Overhead
LPAR
CPW
CPW
Increase
Total
LPAR
CPW
Stand alone
12-way
CPW
LPAR
Configuration
Table 18.1 12-way system measurements
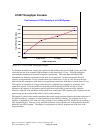
While we saw performance improvements on a 12-way system as shown above, part of those
improvements may have come about because of a reduction in contention within the CPW workload
itself. That is, the measurement of the standalone 12-way system required a larger number of users to
drive the system’s CPU to 70 percent than what is required on a 4-way system. The larger number of
users may have increased the CPW workload’s internal contention.
With a lower number of users required to drive the system’s CPU to 70 percent on a standalone 4-way
system., there is less opportunity for the workload’s internal contention to be a factor in the
measurements.
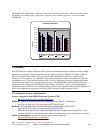
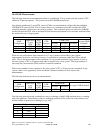
The following chart shows our 4-way measurements.
3 %101910255%20441950(2) 2-ways
SecondaryPrimary
Average
LPAR Overhead
LPAR
CPW
CPW
Increase
Total
LPAR
CPW
Stand alone
4-way
CPW
LPAR
Configuration
Table 18.2 4-way system measurements
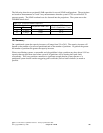
The following chart shows the overhead on n-ways of running a single LPAR partition alone vs. running
with other partitions. The differing values for managing partitions is due to the size of the memory nest
and the number of processors to manage (n-way size)
.
-9.0 %
12
6.0 %-8
-3.0 %4
1.5 %-2
ProjectedMeasuredProcessors
Table 18.3 LPAR overhead per partition
IBM i 6.1 Performance Capabilities Reference - January/April/October 2008
© Copyright IBM Corp. 2008 Chapter 18 - LPAR 299


