


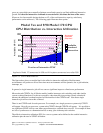
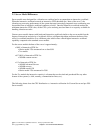
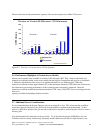
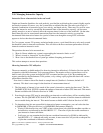
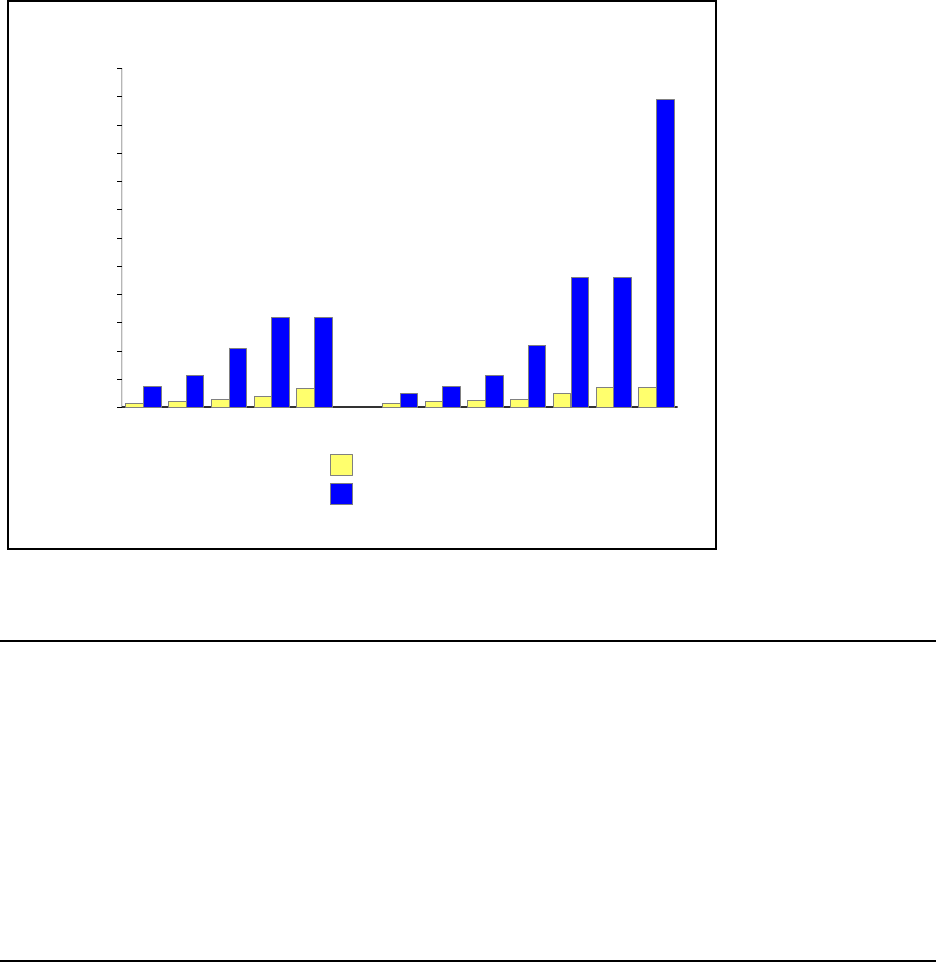
The next chart shows the performance capacity of the current and previous Model 170 servers.
Previous vs. Current AS/400e server 170 Performance
* Unconstrained V4R2 rates
73
114
210
319 319
50
73
115
220
460 460
1090
16
23
29
40
67
15
20
25
30
50
70 70
2159 2160 2164 2176 2183 2289 2290 2291 2292 2385 2386 2388
0
200
400
600
800
1000
1200
CPW Values
Interactive
Processor
Current
Previous *
Figure 2.5. Previous vs. Current Server 170 Performance
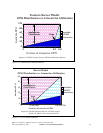
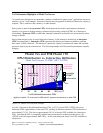
2.6 Performance Highlights of Custom Server Models
Custom server models were available in releases V4R1 through V4R3. They interact with batch and
interactive workloads similar to the server models but the degree of interaction and priority of workloads
is different, and the knee of the curve for workload interaction is at a different point. When the
interactive workload exceeds approximately 6/7 of the maximum interactive CPW (the knee of the curve),
the client/server processing performance of the system becomes increasingly impacted. Once the
interactive workload reaches the maximum interactive CPW value, all the CPU cycles are being used and
there is no
capacity available for handling client/server tasks.
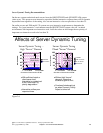
2.7 Additional Server Considerations
It is recommended that the System Operator job run at runpty(9) or less. This is because the possibility
exists that runaway interactive jobs will force server/interactive overhead to their maximum. At this
point it is difficult to initiate a new job and one would need to be able to work with jobs to hold or cancel
runaway jobs.
You should monitor the interactive activity closely. To do this take advantage of PM/400 or else run
Collection Services nearly continuously and query monitor data base each day for high interactive use
IBM i 6.1 Performance Capabilities Reference - January/April/October 2008
© Copyright IBM Corp. 2008 Chapter 2 - Server Performance Behavior 24