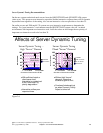
one third of the total possible interactive workload, for non-custom models. The equation shown in this
section will migrate a traditional system to a server system and keep the interactive workload at or below
the knee of the curve, that is, using less than two thirds of the total possible interactive workload. In some
environments these equations will be too conservative. A value of 1.2, rather than 1.5 would be less
conservative. The equations presented in the Interactive Utilization section should be used by those
customers who understand how server models work above the knee of the curve and the ramifications of
the V4R1 enhancement.
These equations are for migration of “existing workload” situations only. Installation workload
projections for “initial installation” of new custom servers are generally sized by the business partner for
50 - 60% CPW workloads and no “formula increase” would be needed.
For example, assume a model 510-2143 with a single V3R6 CPW rating of 66.7 and assume the
Performance Tools for iSeries report lists interactive work CPU utilization as 21%. Using the previous
formula, the server model must have an interactive CPW rating of at least 42 to maintain the same
performance as the 510-2143.
Server interactive CPW = 3 * P * Traditional CPW
= 3 * .21 * 66.7
= 42
A server model with an interactive CPW rating of at least 42 could approximate the same interactive
work of the 510-2143, and still leave system capacity available for client/server activity. An S20-2165 is
the first AS/400e series with an acceptable CPW rating (49.7).
Note that interactive and client/server CPWs are not additive. Interactive workloads which exceed (even
briefly) the knee of the curve will consume a disproportionate share of the processing power and may
result in insufficient system capacity for client/server activity and/or a significant increase in interactive
response times.
2.12 Upgrade Considerations for Interactive Capacity
When upgrading a system to obtain more processor capacity, it is important to consider upgrading the
interactive capacity, even if additional interactive work is not planned. Consider the following
hypothetical example:
y The original system has a processor capacity of 1000 CPW and an interactive capacity of 250 ICPW
y The proposed upgrade system has a processor capacity of 4000 CPW and also offers an interactive
capacity of 250 ICPW.
y On the original system, the interactive capacity allowed 25% of the total system to be used for
interactive work. On the new system, the same interactive capacity only allows 6.25% of the total
system to be used for interactive work.
y Even though the total interactive capacity of the system has not changed, the faster processors (and
likely larger memory and faster disks) will allow interactive requests to complete more rapidly, which
can cause greater spikes of interactive demand.
y So, just as it is important to consider balancing memory and disk upgrades with processor upgrades,
optimal performance may also require an interactive capacity upgrade when moving to a new system.
IBM i 6.1 Performance Capabilities Reference - January/April/October 2008
© Copyright IBM Corp. 2008 Chapter 2 - Server Performance Behavior 34


