2.10 Managing Interactive Capacity
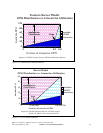
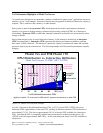
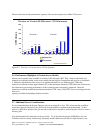
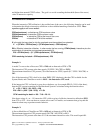
Interactive/Server characteristics in the real world.
Graphs and formulas listed thus far work perfectly, provided the workload on the system is highly regular
and steady in nature. Of course, very few systems have workloads like that. The more typical case is a
dynamic combination of transaction types, user activity, and batch activity. There may very well be cases
where the interactive activity exceeds the documented limits of the interactive capacity, yet decreases
quickly enough so as not to seriously affect the response times for the rest of the workload. On the other
hand, there may also be some intense transactions that force the interactive activity to exceed the
documented limits interactive feature for a period of time even though the average CPU utilization
appears to be less than these documented limits.
For 7xx systems, current 170 systems, and mixed-mode servers, a goal should be set to only rarely exceed
the threshold value for interactive utilization. This will deliver the most consistent performance for both
interactive and non-interactive work.
The questions that need to be answered are:
1. “How do I know whether my system is approaching the interactive limits or not?”
2. “What is viewed as ‘interactive’ by the system?”
3. “How close to the threshold can a system get without disrupting performance?”
This section attempts to answer these questions.
Observing Interactive CPU utilization
The most commonly available method for observing interactive utilization is Collection Services used in
conjunction with the Performance Tools program product. The monitor collects system data as well as
data for each job on the system, including the CPU consumed and the type of job. By examining the
reports generated by the Performance Tools product, or by writing a query against the data in the various
performance data base files.
Note: data is written to these files based on sample interval (Smallest is 5 minutes, default is 15
minutes). This data is an average for the duration of a measurement interval.
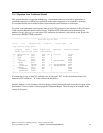
1. The first metric of interest is how much of the system’s interactive capacity has been used. The file
QAPMSYSCPU field SCIFUS contains the amount of interactive feature CPU time used. This metric
became available with Collection Services in V4R5.
2. Even though average CPU may be reasonable your interactive workload may still be exceeding limits
at times. The file QAPMSYSCPU field SCIFTE contains the amount of time the interactive threshold
was exceeded during the interval. This metric became available with Collection Services in V4R5.
3. To determine what jobs are responsible for interactive feature consumption, you can look at the data
in QAPMJOBL (Collection Services) or QAPMJOBS (Performance Monitor):
y If using Collection Services on a V5R1 or later system, those jobs which the machine considers to
be interactive are indicated by the field JBSVIF =’1’. These are all jobs that could contribute to
your interactive feature utilization.
y In all cases you can examine the jobs that are considered interactive by OS/400 as indicated by
field JBTYPE = “I”. Although not totally accurate, in most cases this will provide an adequate list
of jobs that contributed to interactive utilization.
IBM i 6.1 Performance Capabilities Reference - January/April/October 2008
© Copyright IBM Corp. 2008 Chapter 2 - Server Performance Behavior 29


