


Notes:
y Capacity metrics are provided for nonsecure and each variation of security policy
y The table data reflects System i as a server (not a client)
y This is only a rough indicator for capacity planning. Actual results may differ significantly.
y Each SSL connection was established with a 1024 bit RSA handshake.
6.531.936.953.355.7478.4
Large Transfer
(Stream) 16K Bytes
4.827.431.348.053.4249.7
Asym. Connect/Request/Response
(ACRR) 8K Bytes
202.2462.1479.6530.0565.41167
Request/Response
(RR) 128 Byte
TDES /
SHA-1
AES256 /
SHA-1
AES128 /
SHA-1
RC4 /
SHA-1
RC4 /
MD5
Nonsecure
TCP/IP
Transaction Type:
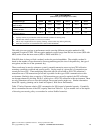
SSL Performance
(transactions per second per server CPU)
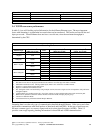
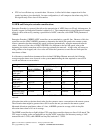
Table 5.6
This table gives an overview on performance results on using different encryption methods in SSL
compared to regular TCP/IP. The encryption methods we used range from fast but less secure (RC4 with
MD5) to the slower but more secure (AES or TDES with SHA-1).
With SSL there is always a fixed overhead, such as the session handshake. The variable overhead is
based on the number of bytes that need to be encrypted/decrypted, the size of the public key, the type of
encryption, and the size of the symmetric key.
These results may be used to estimate a system’s potential transaction rate at a given CPU utilization
assuming a particular workload and security policy. Say the result of a given test is 5 transactions per
second per server CPU. Then multiplying that result with 50 will tell that at 50% CPU utilization a
transaction rate of 250 transactions per second is possible for this type of SSL communication on this
environment. Similarly when a capacity of 100 transactions per second is required, the CPU utilization
can be approximated by dividing 100 by 5, which gives a 20% CPU utilization in this environment. These
are only estimations on how to size the workload, since actual results might vary. Similar information
about SSL capacity planning can be found in Chapter 6, Web Server Performance.
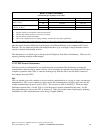
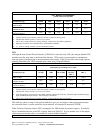
Table 5.7 below illustrates relative CPU consumption for SSL instead of potential capacity. Essentially,
this is a normalized inverse of the CPU capacity data from Table 5.6. It gives another view of the impact
of choosing one security policy over another for various NetPerf scenarios.
IBM i 6.1 Performance Capabilities Reference - January/April/October 2008
© Copyright IBM Corp. 2008 Chapter 5 - Communications Performance 70