


Board Manual 115
Intel
®
IQ80321 I/O Processor Evaluation Platform
Getting Started and Debugger
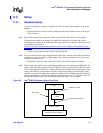
C.7.3 Displaying Source Code
1. Launch the Code|Lab EDE Debugger and open the “Tester321LED” ELF program.
Note: Use the File/Recent Programs menu for quick access.
2. Select the “Files” view in the lower tab of the WorkSpace window.
3. Bring up “blink.c” and “led.c” source code by double-clicking each filename.
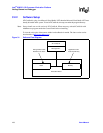
4. Use the “Windows” Menu to arrange the windows, or maximize, minimize, and resize
manually as desired.
5. Press the “Mixed” tab at the bottom of the “blink.c” window. Notice that the assembly along
with each C statement.
6. Press the “Source” tab to revert back to C code only.
C.7.4 Using Breakpoints
Note the small gray circles on the sidebar beside each line of source code. Single-click any of these
gray circles and a red dot appears. The red dot represents a break point. Single-click the red dot to
remove it, or click the “Remove all breakpoints” icon.
Place a breakpoint on the following lines of code in “blink.c”:
displayLED(leds[8],leds[0]); /* LED display '80' */
displayLED(leds[0],leds[3]); /* LED display '03' */
displayLED(leds[3],leds[2]); /* LED Display '32' */
displayLED(leds[2],leds[1]); /* LED display '21' */
displayLED(leds[16],leds[16]); /* LED display ' ' */
1. Click the “Go” icon.
The yellow arrow stops at the first break point and the HEX display does not change.
2. Click the “Go” icon again.
The last instruction has now been executed and an “80” is displayed.
3. Continue on in this fashion, watching the lines execute only as they are called, while the
yellow arrow shows exactly what line is up next in execution.
4. Click the “Remove all breakpoints” icon.
5. Press “Go” again and notice that the program loop is infinite.
6. Press the “Halt” icon to stop execution.
7. Close the debugger and cycle power to the board.