


Chapter 6 Tutorial
Xmath Model Reduction Module 6-4 ni.com
recovery at low frequencies; there is consequently a faster roll-off of the
loop gain at high frequencies than for , and this is desired.
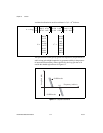
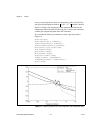
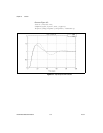
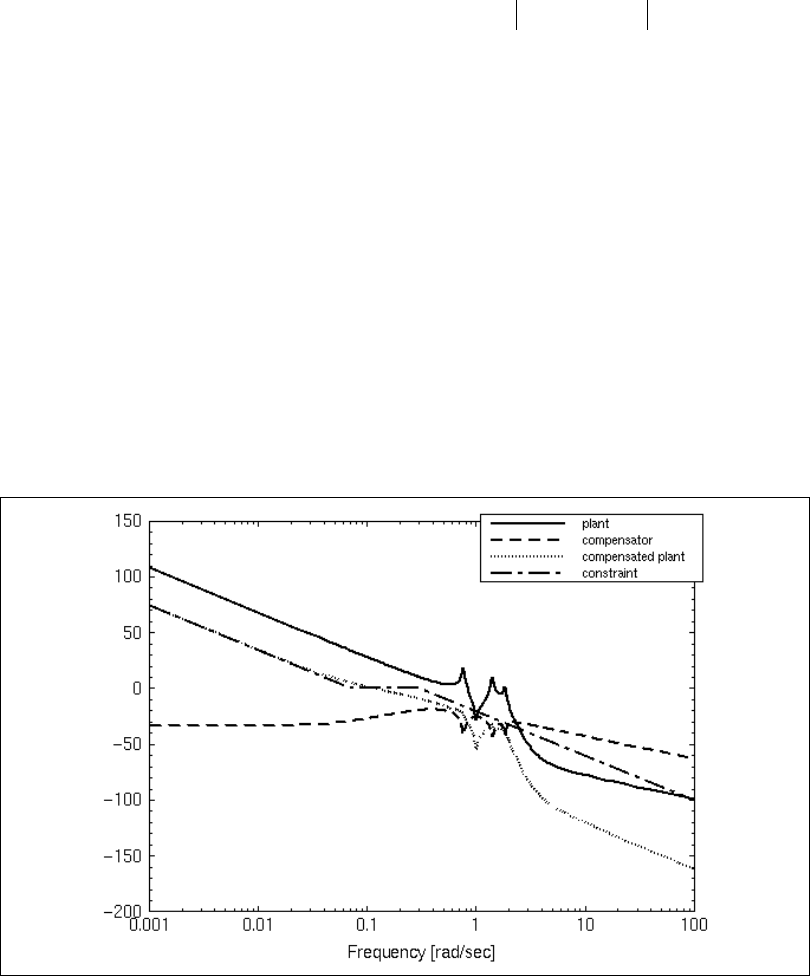
Figure 6-2 displays the (magnitudes of the) plant transfer function, the
compensator transfer function and the loop gain, as well as the constraints;
evidently the compensated plant meets the constraints.
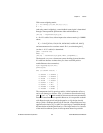
You can enter the following commands to create a plot equivalent to
Figure 6-2:
sysol=sys*sysc;
svals=svplot(sys,w,{radians});
svalsc=svplot(sysc,w,{radians});
svalsol=svplot(sysol,w,{radians});
plot(svals,{x_log,!grid,!ylab,
line_width=2,hold})
plot(svalsc,{keep})
plot(svalsol,{keep})
f2=plot(wc,constr,{keep,
legend=["plant","compensator",
"compensated plant","constraint"]})
plot({!hold})
Figure 6-2. Frequency Response for Plant, Compensator, and Compensated Plant
K
r
jωIA–()
1–
B