


700 Series Managed Switch User’s Guide for Software v2.1
Web-Based Management Interface 5-9
SM-10004-02
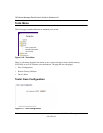
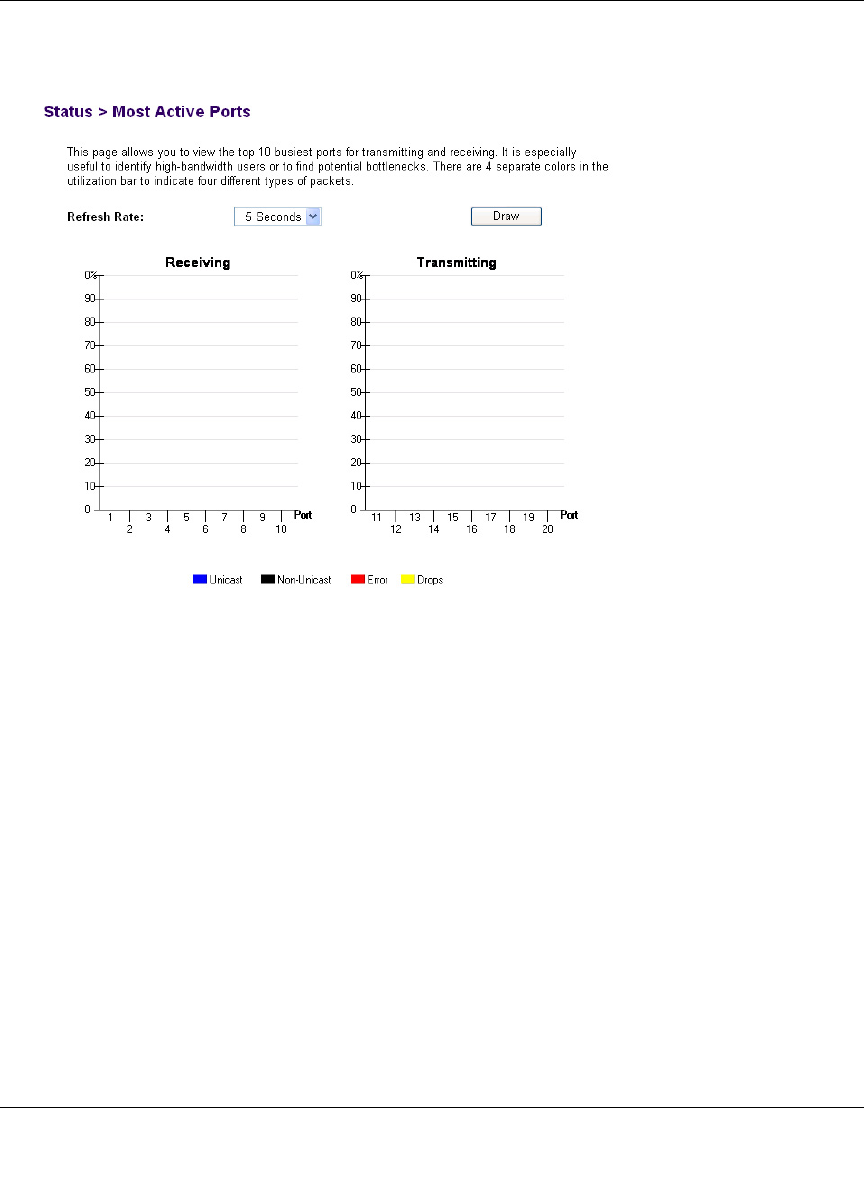
Status > Most Active Ports
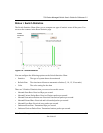
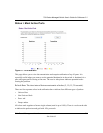
Figure 5-7: Error Statistics
This page allows you to view the transmission and reception utilization of top 10 ports. It is
especially useful when you want to see the potential bottlenecks in the switch. A bottleneck is a
port with egress traffic closing to line rate. The receive side picture indicates potential nodes
causing the problem.
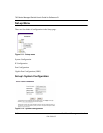
Refresh Rate: The time interval between automatic refreshes (5, 10, 15, 30 seconds).
There are four separate colors in the utilization bar to indicate four different types of packets:
• Unicast: blue
• Non-Unicast: black
• Error: red
• Drops: amber
All colors stack together to form a single column (total is up to 100%). There is a scale on the side
to indicate the packet/seconds grid with 10% per notch.