


22
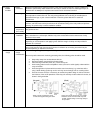
3. Weibull Analysis
Weibull analysis is often used for classifying a product's failure patterns and to determine its lifetime.
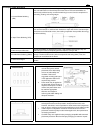
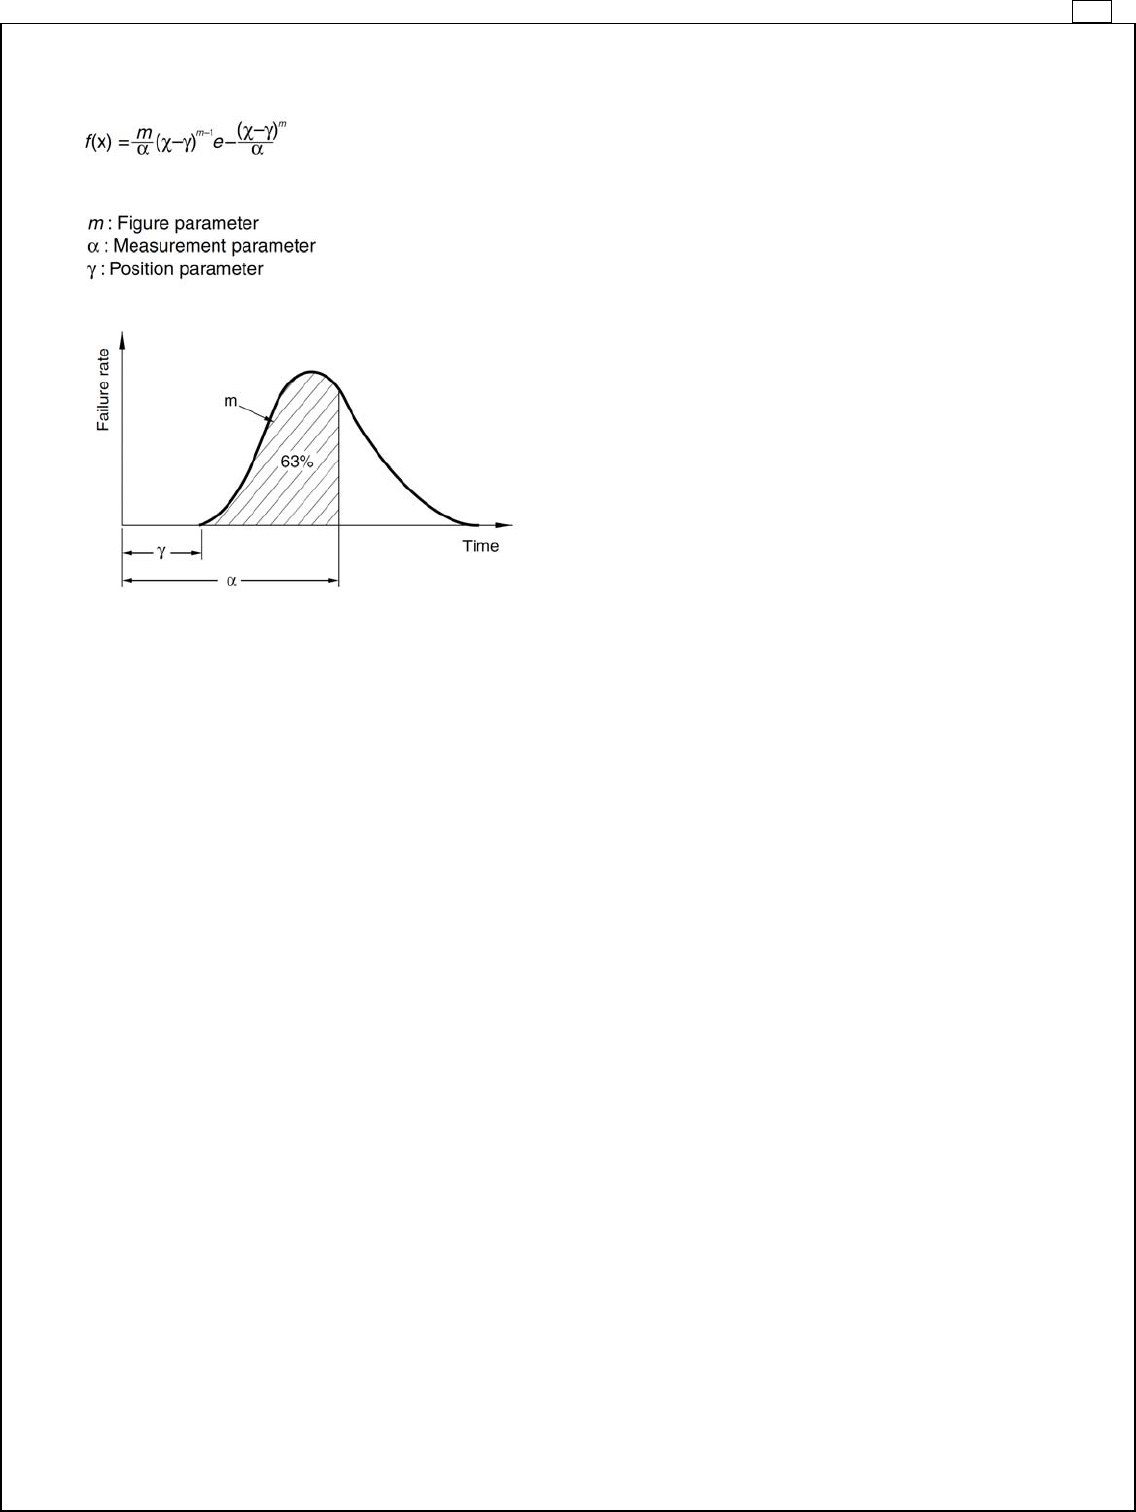
Weibull distribution is expressed by the following equation:
where
Weibull distribution can be adopted to the actual failure rate distribution if the three variables above are estimated.
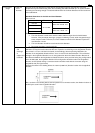
The Weibull probability chart is a simpler alternative of complex calculation formulas. The chart provides the following advantages:
(1) The Weibull distribution has the closest proximity to the actual failure rate distribution.
(2) The Weibull probability chart is easy to use.
(3) Different types of failures can be identified on the chart.
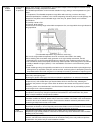
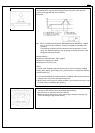
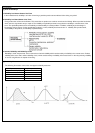
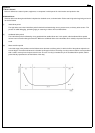
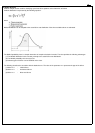
The following describes the correlation with the bathtub curve. The value of the parameter "m" represents the type of the failure.
(1) When m < 1 : Initial failures
(2) When m = 1 : Accidental failures
(3) When m > 1 : Wear-out failures