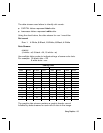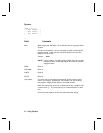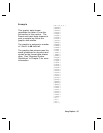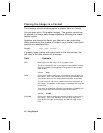
The data stream uses letters to identify dot counts.
◆
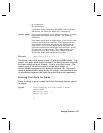
CAPITAL letters represent black dots.
◆
lowercase letters represent white dots.
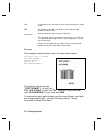
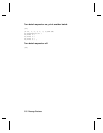
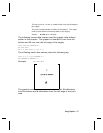
Using the chart below, the data stream for row 1 would be:
Dot count:
Row 1: 4 White, 8 Black, 19 White, 8 Black, 4 White
Data Stream:
dHsHd p
(4 white = d, 8 black = H, 19 white = s)
Use multiple letter codes to indicate strings of same-color dots.
For example: 30 black dots = ZD
9 white dots = ccc
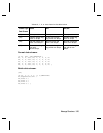
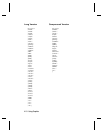
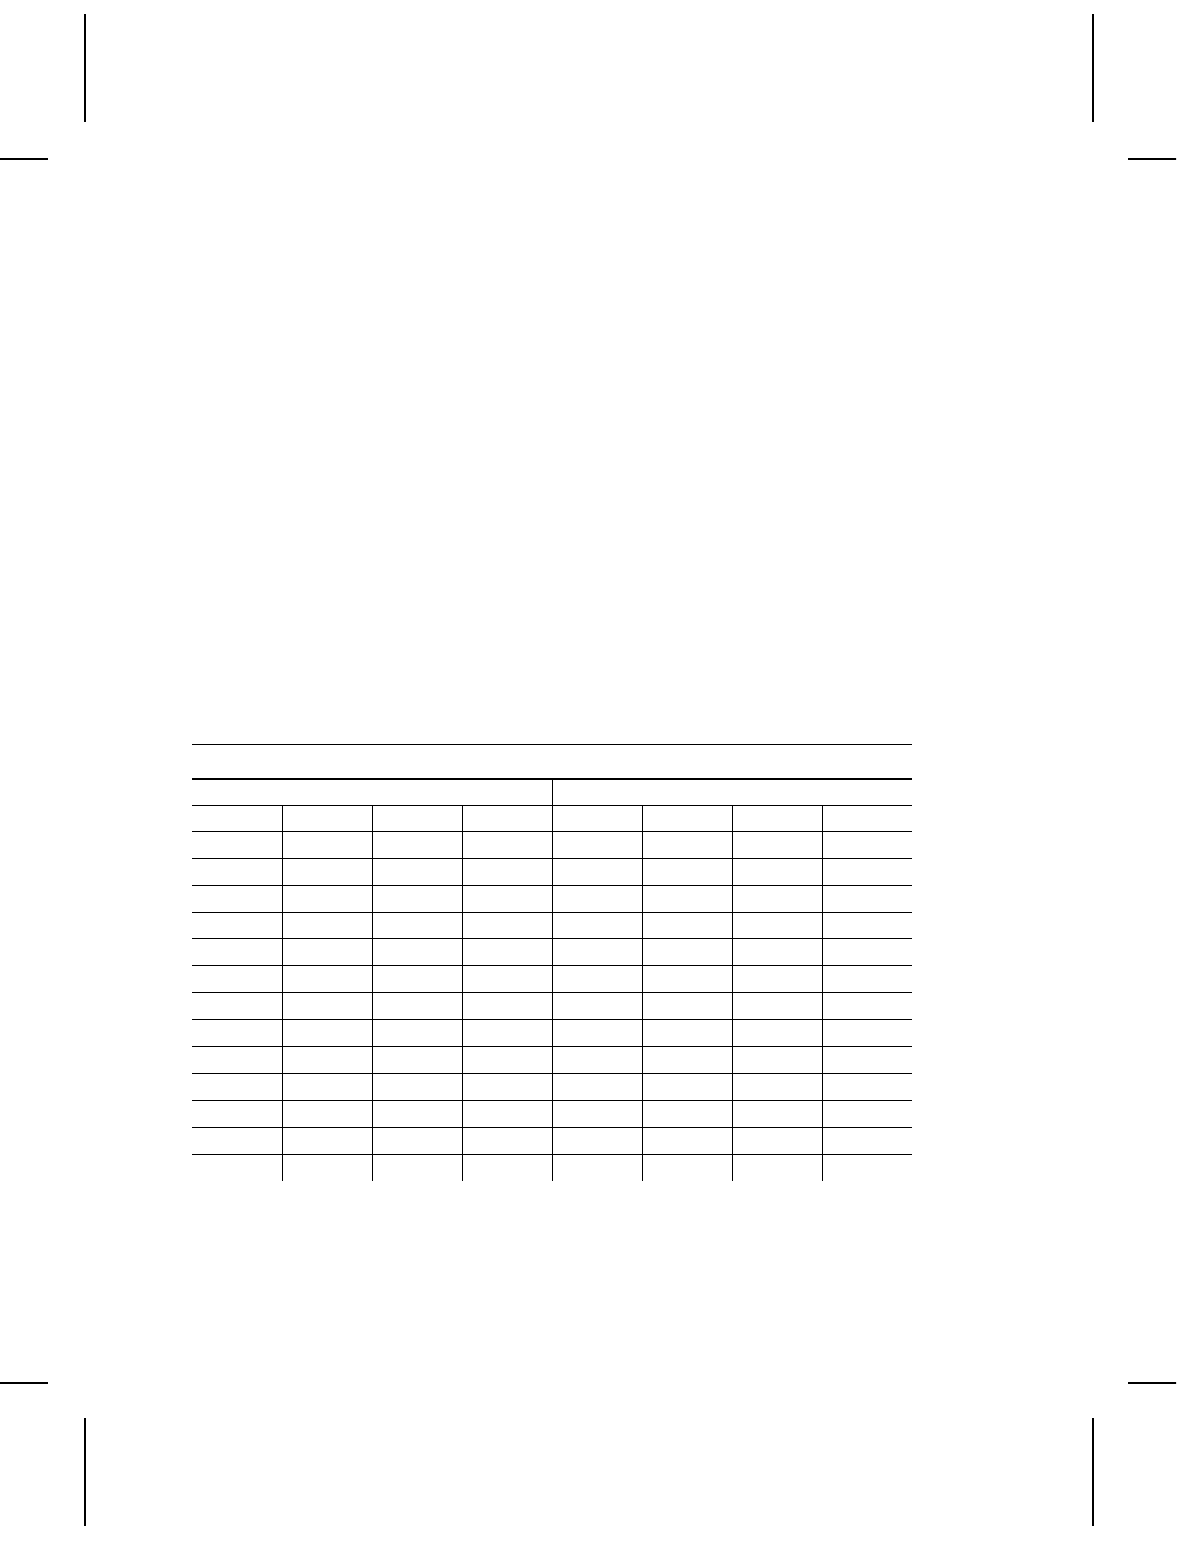
Coding Chart
Black Dots White Dots
#dots Code # dots Code # dots Code # dots Code
1A14N1a14n
2 B 15 O 2 b 15 o
3C16P3c16p
4D17Q4d17q
5E18R5e18r
6F19S6f19s
7G20T7g20t
8H21U8h21u
9I22V9i22v
10 J 23 W 10 j 23 w
11 K 24 X 11 k 24 x
12 L 25 Y 12 l 25 y
13 M 26 Z 13 m 26 z
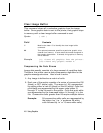
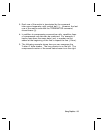
The graphic data stream contains a graphic header record
followed by data streams for each row of dots in the image.
Using Graphics 4-3


