64
3.17 Trace Function
The trace function of the E10A emulator is described.
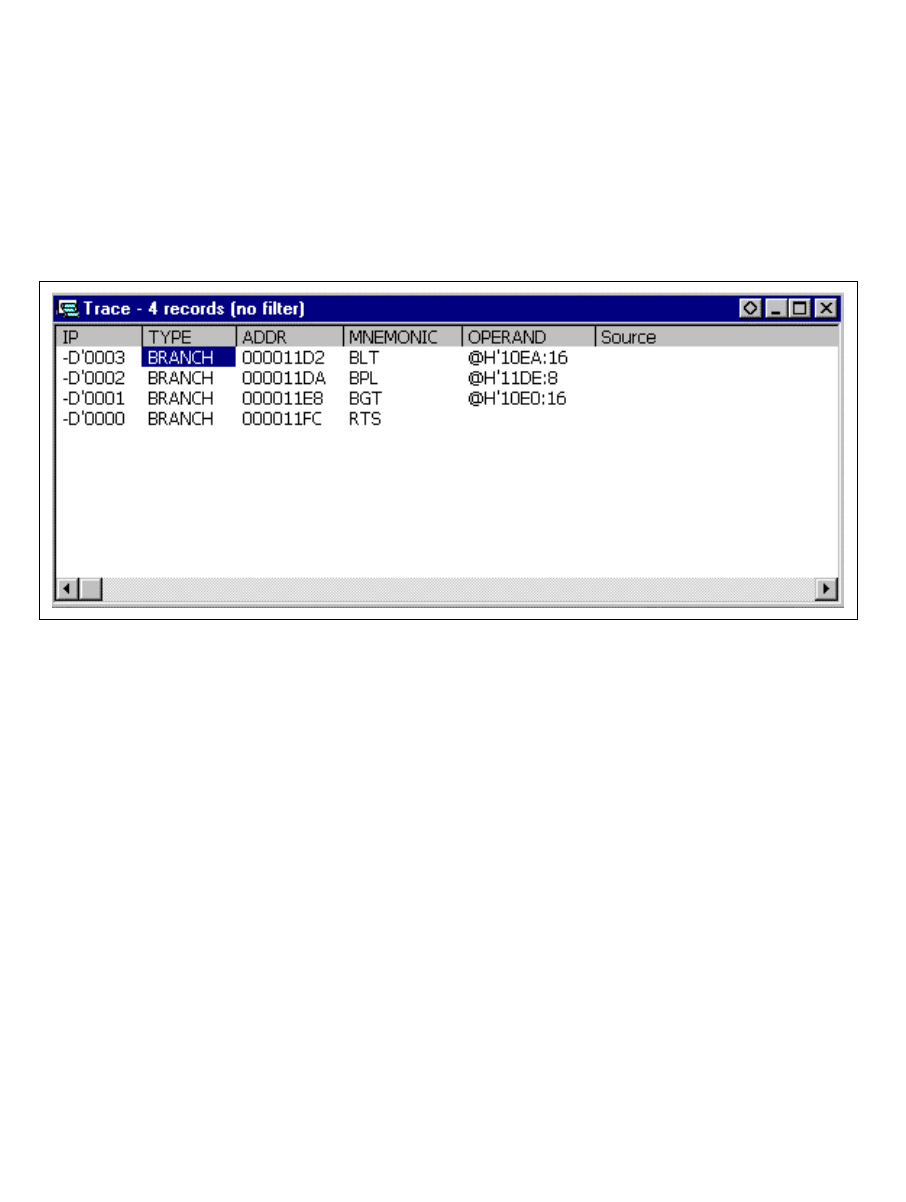
The branch source addresses, mnemonics, operands, and source lines are displayed. Since this
function uses the trace buffer built into the MCU, a realtime trace can be acquired.
Run the program as shown in the example of section 3.15.1, Software Break Function. The trace
results are displayed in the [Trace] window after the program execution is completed.
Figure 3.47 [Trace] Window
•
If necessary, adjust the column width by dragging the header bar immediately below the title
bar.
Note: The number of branch instructions that can be acquired by a trace differs according
to the product. For the number that can be specified for each product, refer to the
on-line help.


