


93
Chapter 8: Application Examples
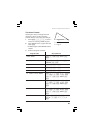
T test
The T-test value is obtained by comparing the mean values of sample data
and expected average from sample data. Using the t- distribution table, the
reliability of a mean value can be evaluated.
Example
A’s SHOP sells cookies by package on which it is stated contents are 100 g.
Buy 6 sample packages and check if the statement is true.
• Setting an expected mean value as 100 (m = 100 g), a t-test value is
obtained. If it is larger than the expected t-value obtained from a t-
distribution table (at 5% of risk rate), the estimation is wrong. (In this
case, A’s SHOP does not sell honestly.)
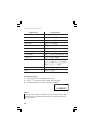
Sample 1 2 3 4 5 6
grams 102 95 107 93 110 98
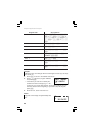
1.
Press b 2 1 0 to open a window for creating a NEW program.
2. Type TTEST for the title then press e.
•A NEW program called ‘TTEST’ will be created.
3. Enter the program as follows.
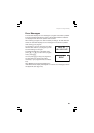
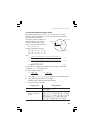
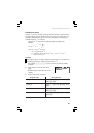
t = ———
m = expected mean value estimated by sample data
n = the number of samples
x = actual mean value of the samples
sx = standard deviation of the samples
x – m
sx
2
n
——
–
–