


109
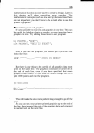
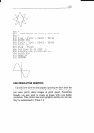
20 LINE.8$=CHR$(27)+CHR$(65)+CHR$(8)+CHR$(27)+
CHR$(5Oj
40 LINE.l2$=CHR$(27>+CHR$(65)+CHR$(l2)tCHR$(27)t
CHEI$(50)
PLOTTING WITH YOUR PRINTER
This section of the manual gets into more serious BASIC pro-
gramming just because it’s required in order to have the com-
puter act as a plotter driver. Don’t be intimidated; while it’s
beyond the scope of this manual to teach BASIC, if you try the
examples and take it slowly you should be doing some fancy plot-
ting of your own before you know it.
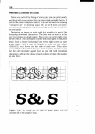
If designing and calculating dot graphics images by laying
them out on graph paper seems too tedious to you, then let the
computer do the work for you! With your computer doing the
calculations and your printer plotting the output, you can come
up with some terrific business graphs, charts, and mathematical
function plots.
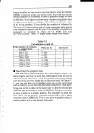
The best way to do this is to set up an array in memory. This
is your “graph paper.” The first thing to do is to determine how
big you want your output to be; this will determine the size of
your array. (If you have grandiose plans to fill an entire page
with plotter output, you better have lots of memory in your com-
puter. With 60 dots per inch horizontally and 72 dots per inch
vertically, it takes at least 540 bytes of memory for each square
inch of plotted area. That doesn’t sound so bad - but an area 8
inches square requires over 32K!)
Your array should be two-dimensional (just like graph paper)
where one dimension will be the number of columns of dots and
the other dimension is the number of printing lines (remember
that you can have up to eight rows of dots per printed line).
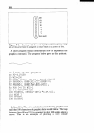
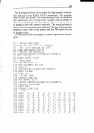
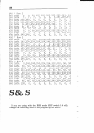
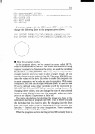
Here’s a program that will use calculated-shape graphics to
plot a circle. As you’ll see, by changing a few lines it can be used
to plot virtually any shape.
10 1 Plotting program
20 1 Set program constants
30 MAXCOL%=75 : MAXROW%=
40 DIM BIT%(MAXCOL%,MAXROW%)
50 MASK%(l)=64 : MASK%(4)=8
60 MASK%(2)=32 : MASK%(5)=4
70 MASK%(3)=16 : MASK%(6)=2