


3-4
User Guide for the Cisco Network Analysis Module (NAM) Traffic Analyzer, 5.0
OL-22617-01
Chapter 3 Monitoring and Analysis
Traffic Summary
Traffic Summary
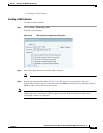
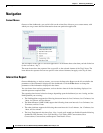
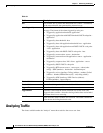
The Traffic Summary Dashboard allows you to view the Top N Applications, Top N Application Groups,
Top N Hosts (In and Out), IP Distribution by Bytes, Top N DSCP, and Top N VLAN being monitored on
your network. It provides auto-monitoring of traffic from all potential data sources (for example, SPAN,
NDE, and WAAS). You can get to the Traffic Summary Dashboard by going to Monitor > Overview >
Traffic Summary.
You can use the Interactive Report on the left to filter the information for a particular Site, Data Source,
VLAN, or reporting time interval. You can specify just one type of criteria and leave the others blank,
or specify all of them. You can also choose to view the Rate or cumulative data from the Interactive
Report.
When you log into the NAM for the first time, the default view will be the Traffic Summary dashboard,
and the top data source is selected by default.
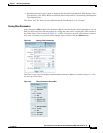
For each chart described below, you can left-click on any colored bar to get to a context menu, with
which you can get more detailed information about that item.
The charts shown on this dashboard are:
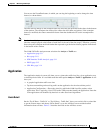
• Top N Applications
The Top N Applications Chart enables you to view the traffic rate (bytes per second or bits per
second) or traffic volume (bytes or bits), depending on the Interactive Report filter selection (data
rate or cumulative, respectively). When you place your cursor over the colored bar, you will see the
number of bytes per second collected or the total bytes over the last time interval.
If you left-click on a colored bar and choose “Capture” from the context menu, you can start a
capture on this data (see
Chapter 4, “Capturing and Decoding Packet Data” for more information
about Capture).
• Top N Application Groups
This chart shows a detailed analysis of the Top N application groups and the traffic rate or volume
for this interval. In the Interactive Report, you can select either rate or cumulative, where rate is the
bytes per second, and cumulative is the total number of bytes.
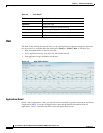
• Top N Hosts (In and Out)
This chart displays the traffic rate (bytes per second or bits per second) or traffic volume (bytes or
bits). To get more specific details about the host activity, left-click on the colored bar and make a
selection. You can also choose “Capture” from the context menu to start a capture on this data (see
Chapter 4, “Capturing and Decoding Packet Data” for more information about Capture).
• IP Distribution by Bytes
This chart shows the percentages of bytes being distributed to IP protocols (for example, IPv4 TCP).
• Top N DSCP
This chart shows statistics for the top DSCP Aggregation Groups.
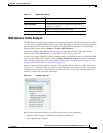
• Top N VLAN
This chart shows the Top N VLAN statistics. In this chart, you may see VLAN 0, which is for traffic
that does not have any VLAN tags. You can also use this value in Capture to do filtering.
If you left-click on a colored bar and choose “Capture” from the context menu, you can start a
capture on this data (see
Chapter 4, “Capturing and Decoding Packet Data” for more information
about Capture).