3-31
User Guide for the Cisco Network Analysis Module (NAM) Traffic Analyzer, 5.0
OL-22617-01
Chapter 3 Monitoring and Analysis
Managed Device
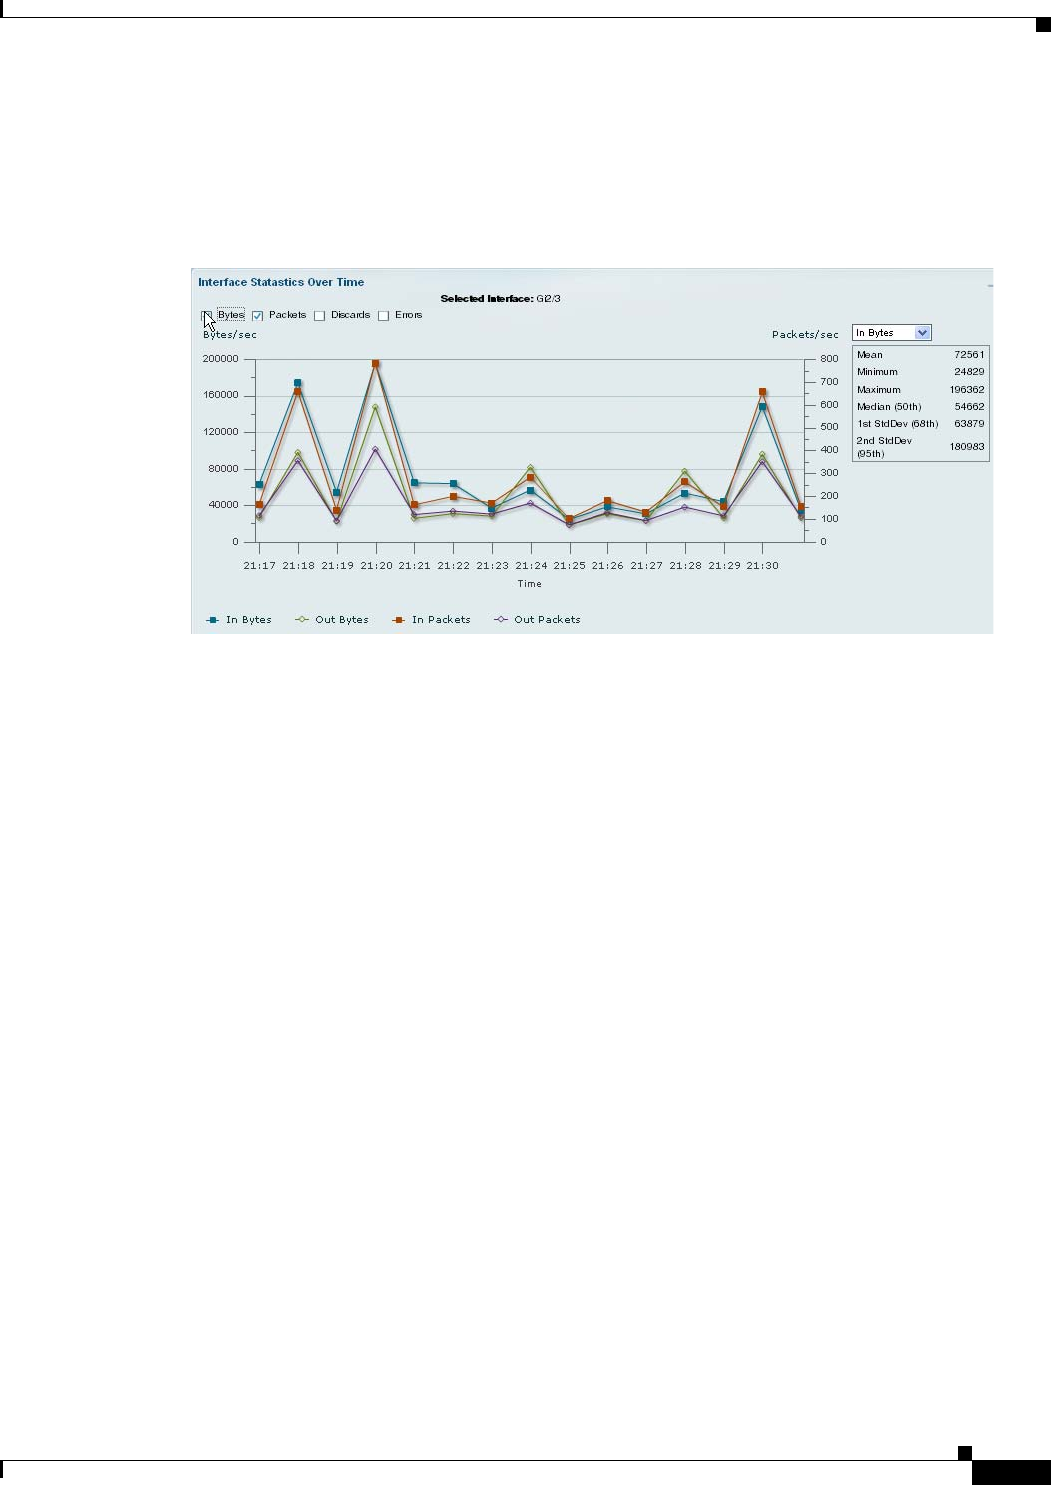
Interface Statistics Over Time
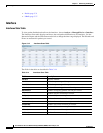
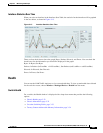
When you select an interface in the Interface Stats Table, the statistics for that interface will be graphed
in the area below, as shown in
Figure 3-13.
Figure 3-13 Interface Statistics Over Time
There are four check boxes above the graph: Bytes, Packets, Discards, and Errors. You can check the
check boxes for the information you would like displayed in the graph:
Bytes: In Bytes, Out Bytes
Packets: In Packets (inUcastPkts + inNUcastPkts ), Out Packets (outUcastPkts + outNUcastPkts)
Discards: In Discards, Out Discards
Errors: In Errors, Out Errors
Health
You can use the NAM Traffic Analyzer to view system health data. To view system health data collected
for the switch or router, choose Monitor > Managed Device > Health from the menu.
Switch Health
For a switch, the Health window is displayed with a drop-down menu that provides the following
options:
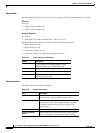
• Chassis Health, page 3-32
• Chassis Information, page 3-32
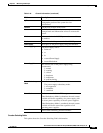
• Crossbar Switching Fabric, page 3-33
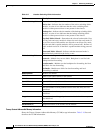
• Ternary Content Addressable Memory Information, page 3-34


