


Chapter 5
Configuration Using the Web-based Utility
29
24/48-Port 10/100 + 4-Port Gigabit Smart Switch with Resilient Clustering Technology and PoE
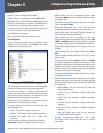
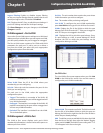
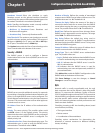
Statistics > RMON Events
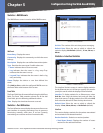
The RMON Events screen is used to define RMON events.
Statistics > RMON Events
Add Event
Event Entry Displays the event.
Community Displays the community to which the event
belongs.
Description Displays the user-defined event description.
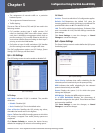
Type Describes the event type. Possible values are:
None Indicates that no event occurred.
Log Indicates that the event is a log entry.•Trap.
Indicates that the event is a trap.
Log and Trap Indicates that the event is both a log
entry and a trap.
Owner Displays the device or user that defined the
event.
Click Add to List to add the configured RMON event to
the Event Table at the bottom of the screen.
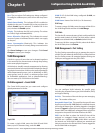
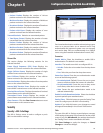
Event Table
The Event Table lists all events defined using the Add Event
fields. The Event Table contains columns for all the Add
Event fields, plus the following additional column:
Time Displays the time that the event occurred.
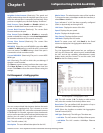
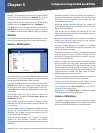
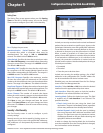
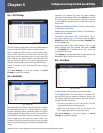
Statistics > Port Utilization
The Port Utilization screen displays the amount of resources
each interface is currently consuming. Ports in green are
functioning normally, while ports in red are currently
transmitting an excessive amount of network traffic.
•
•
•
Statistics > Port Utilization
Unit No The number of the unit that you are managing.
Refresh Rate Select the rate at which to refresh the
statistics display: No Refresh (default), 15 sec, 30 sec, or
60 sec.
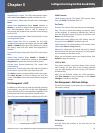
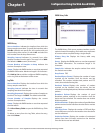
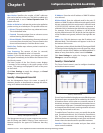
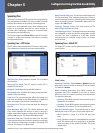
Statistics > Interface Statistics
Statistics > Interface Statistics
The Interface Statistics screen is used to display statistics
for the Ethernet port or LAG that you specify. You can also
specify the rate at which the display will be refreshed.
Interface
To display statistics for an Ethernet port, select
Unit No., then select the desired unit and port from the
drop-down menus. To display statistics for a LAG, select LAG,
then select the desired LAG from the drop-down menu.
Refresh Rate Select the rate at which to refresh the
display: 15 sec, 30 sec, 60 sec, or No Refresh (default).
Interface
This section displays statistics for the packets transmitted
and received on the selected interface.
Receive Statistics Statistics on received packets
Total Bytes (Octets) Displays the number of octets
received on the selected interface.
•