e
Electro Industries/GaugeTech
Doc # E107706 V1.25 2-10
2.7:
Demand
Integrators
Power utilities take into account both energy consumption and peak demand when billing customers.
Peak demand, expressed in kilowatts (kW), is the highest level of demand recorded during a set period
of time, called the interval. The Nexus 1250/1252 supports the following most popular conventions for
averaging demand and peak demand: Thermal Demand, Block Window Demand, Rolling Window
Demand and Predictive Window Demand. You may program and access all conventions concurrently
with the Communicator EXT software (see the Communicator EXT User Manual).
Q
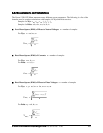
Thermal Demand: Traditional analog watt-hour (Wh) meters use heat-sensitive elements to
measure temperature rises produced by an increase in current flowing through the meter. A pointer
moves in proportion to the temperature change, providing a record of demand. The pointer remains
at peak level until a subsequent increase in demand moves it again, or until it is manually reset. The
Nexus 1250/1252 mimics traditional meters to provide Thermal Demand readings.
Each second, as a new power level is computed, a recurrence relation formula is applied. This
formula recomputes the thermal demand by averaging a small portion of the new power value with a
large portion of the previous thermal demand value. The proportioning of new to previous is
programmable, set by an averaging interval. The averaging interval represents a 90% change in
thermal demand to a step change in power.
Q
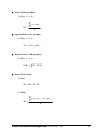
Block (Fixed) Window Demand: This convention records the average (arithmetic mean) demand
for consecutive time intervals (usually 15 minutes).
Example: A typical setting of 15 minutes produces an average value every 15 minutes (at 12:00,
12:15. 12:30. etc.) for power reading over the previous fifteen minute interval (11:45-12:00, 12:00-
12:15, 12:15-12:30, etc.).
Q
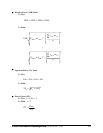
Rolling (Sliding) Window Demand: Rolling Window Demand functions like multiple overlapping
Block Window Demands. The programmable settings provided are the number and length of
demand subintervals. At every subinterval, an average (arithmetic mean) of power readings over the
subinterval is internally calculated. This new subinterval average is then averaged (arithmetic
mean), with as many previous subinterval averages as programmed, to produce the Rolling Window
Demand.
Example: With settings of 3 five-minute subintervals, subinterval averages are computed every 5
minutes (12:00, 12:05, 12:15, etc.) for power readings over the previous five-minute interval (11:55-
12:00, 12:00-12:05, 12:05-12:10, 12:10-12:15, etc.). Further, every 5 minutes, the subinterval aver-
ages are averaged in groups of 3 (12:00. 12:05, 12:10, 12:15. etc.) to produce a fifteen (5x3) minute
average every 5 minutes (rolling (sliding) every 5 minutes) (11:55-12:10, 12:00-12:15, etc.).
Q
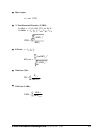
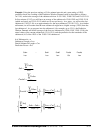
Predictive Window Demand: Predictive Window Demand enables the user to forecast average
demand for future time intervals. The Nexus uses the delta rate of change of a Rolling Window
Demand interval to predict average demand for an approaching time period. The user can set a relay
or alarm to signal when the Predictive Window reaches a specific level, thereby avoiding
unacceptable demand levels. The Nexus 1250/1252 calculates Predictive Window Demand using the
following formula:


