


Harmony Utility 39
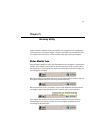
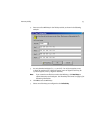
• Receive Signal Strength: The Signal bar displays the signal strength for the last
packet received by the adapter. Signal strength is reported in decibels (dB). The
color-coded chart below the Signal bar indicates the relative strength of the sig-
nal: a signal in the red or orange section indicates a weak connection; a signal in
the yellow or light green section indicates a good connection; a signal in the
darker green section indicates an excellent connection.
• Instantaneous Packets/Sec Received: This statistic displays the current rate at
which the adapter is receiving packets from another 802.11a device. This infor-
mation is represented as the number of packets received per second and is plot-
ted on the graph located below the Packets/sec field. Note that this statistic will
remain zero unless the adapter is receiving data from another device.
• Average Packets/Sec Received:
This statistic displays the average number of
packets received by the adapter each second since the utility was launched.
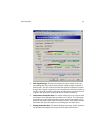
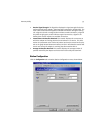
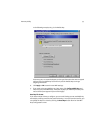
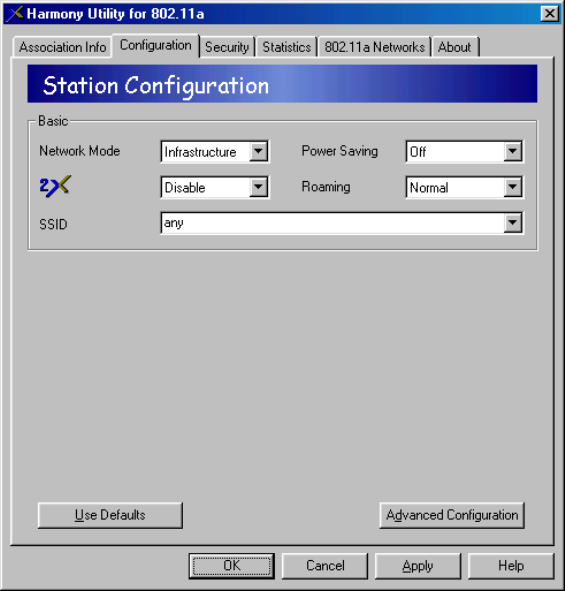
Station Configuration
Click the Configuration tab to view the Station Configuration screen, shown below.