


132 10: Running Total and Statistics
File name : English-M02-1-040308(Print).doc Print data : 2004/3/9
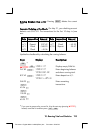
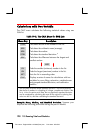
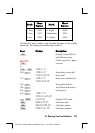
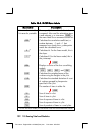
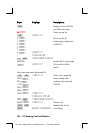
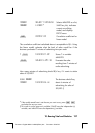
Table 10-3. FRCST Menu Labels
Menu Label Description
list name for x-variable
list name for y-variable
These specify the two lists of data to be
compared. Also used for estimations:store
x and estimate y, or vice-versa. is
the menu label for an unnamed current list.
* Calculates the correlation coefficient, a
number between -1 and +1 that
measures how closely the x,y data points
match the calculated curve.
*
Calculates M. For the linear model, this is
the slope.
Calculates B. For the linear model, this is
the y-intercept.
*
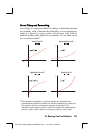
Displays a choice of the four curve-fitting
models:
, , , and .
Calculates the weighted mean of the
x-values using the weights in the y-list.
Calculates the standard deviation of a set
of x-values grouped by frequencies
specified in the y-list.
The number of items in either list.
Sum of items in x-list.
Sum of items in y-list.
Sum of squares of items in x-list.
Sum of squares of items in y-list.
Sum of products of items in x- and y-lists.
*
For the non-linear models, the calculation uses the transformed data values.