


10: Running Total and Statistics 135
File name : English-M02-1-040308(Print).doc Print data : 2004/3/9
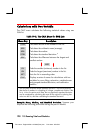
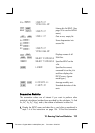
Number of Minutes
of Radio
Advertising
(x-values,
MINUTES
)
Dollar Sales
(y-values,
SALES
)
Week 1
Week 2
Week 3
Week 4
Week 5
Week 6
2
1
3
5
5
4
$1,400
$ 920
$1,100
$2,265
$2,890
$2,200
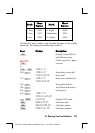
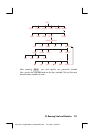
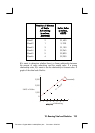
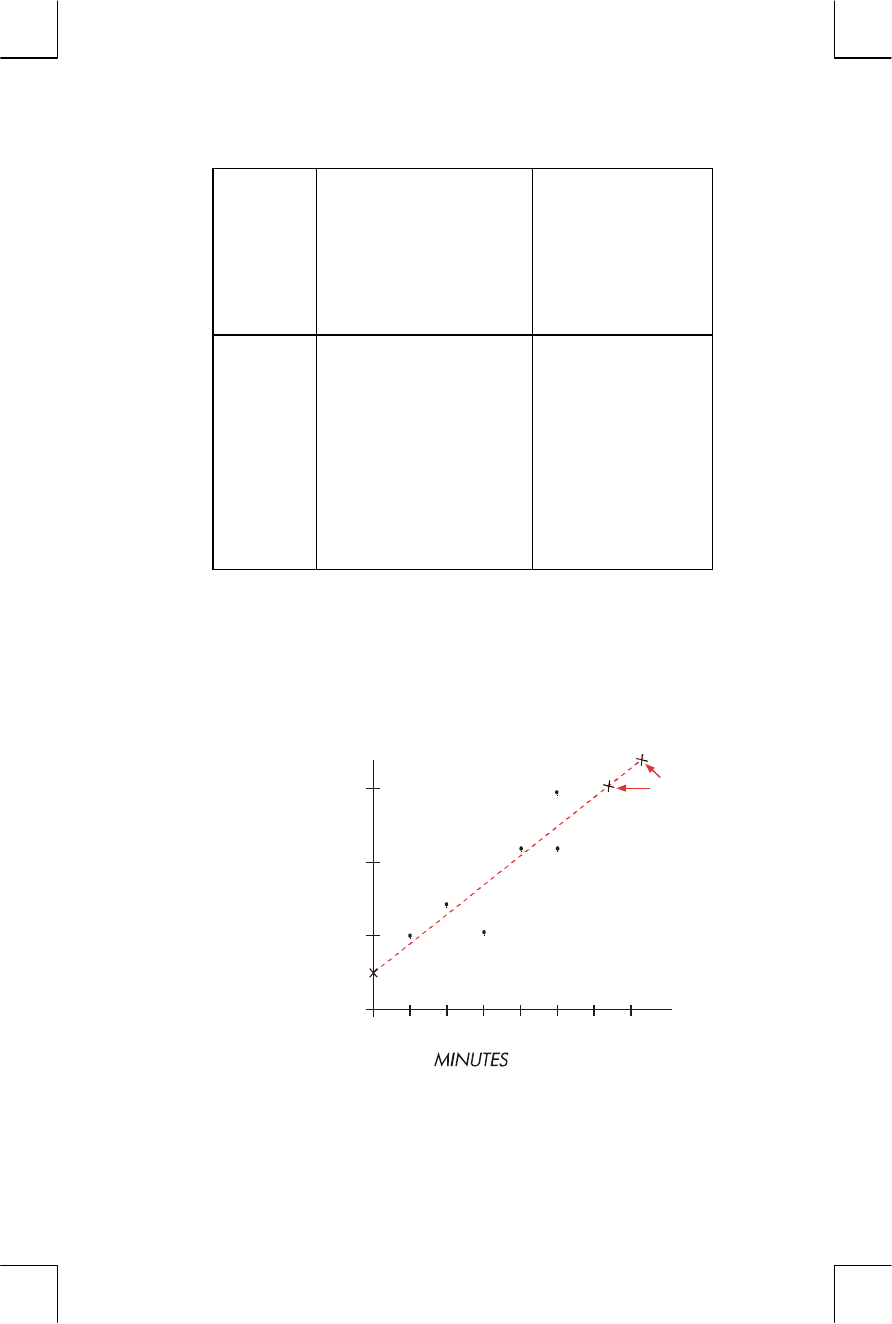
BJ’s wants to determine whether there is a linear relationship between
the amount of radio advertising and the weekly sales. If a strong
relationship exists, BJ’s wants to use the relationship to forecast sales. A
graph of the data looks like this:
01234567
x
1,000
2,000
3,000
y
SALES in Dollars
B
of Advertising
(forecasted)
M4
2
5
.
8
8
=