


Page 10-1
Chapter 10
Graphics
In this chapter we introduce some of the graphics capabilities of the calculator.
We will present graphics of functions in Cartesian coordinates and polar
coordinates, parametric plots, graphics of conics, bar plots, scatterplots, and
fast 3D plots.
Graphs options in the calculator
To access the list of graphic formats available in the calculator, use the
keystroke sequence „ô(D) Please notice that if you are using the
RPN mode these two keys must be pressed simultaneously
to activate any of
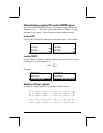
the graph functions. After activating the 2D/3D function, the calculator will
produce
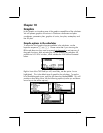
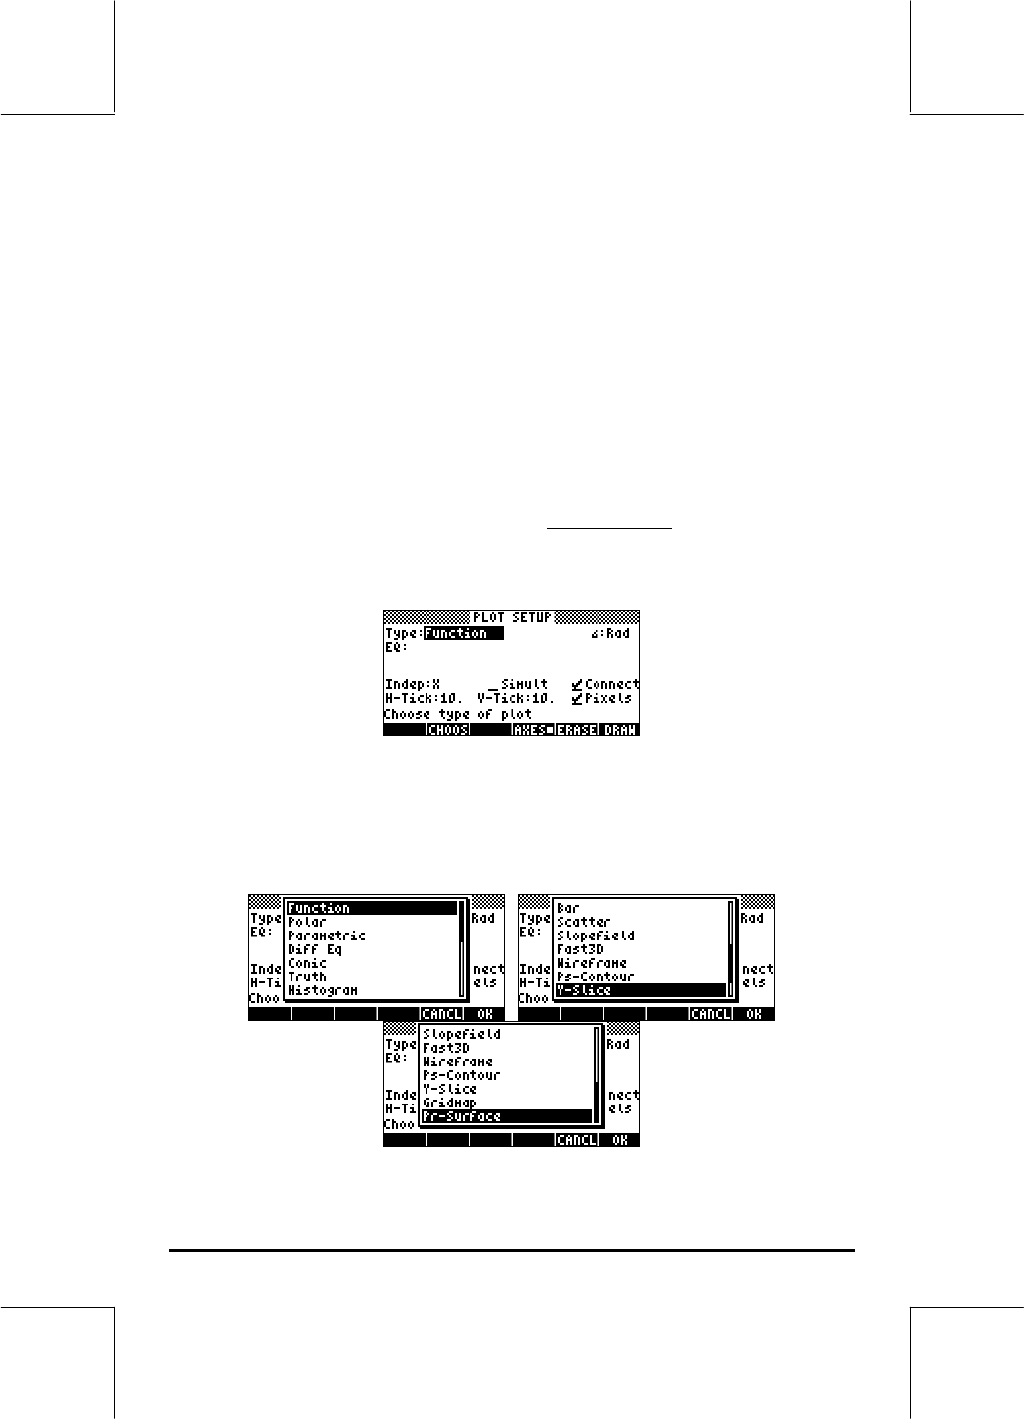
the PLOT SETUP window, which includes the TYPE field as illustrated
below.
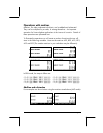
Right in front of the TYPE field you will, most likely, see the option
Function
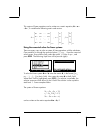
highlighted. This is the default type of graph for the calculator. To see the
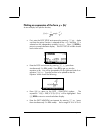
list of available graph types, press the soft menu key labeled @CHOOS. This will
produce a drop down menu with the following options (use the up- and down-
arrow keys to see all the options):