


Page 10-3
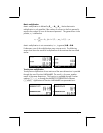
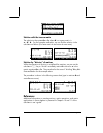
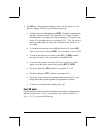
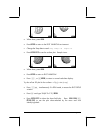
VIEW, then press @AUTO to generate the V-VIEW automatically. The
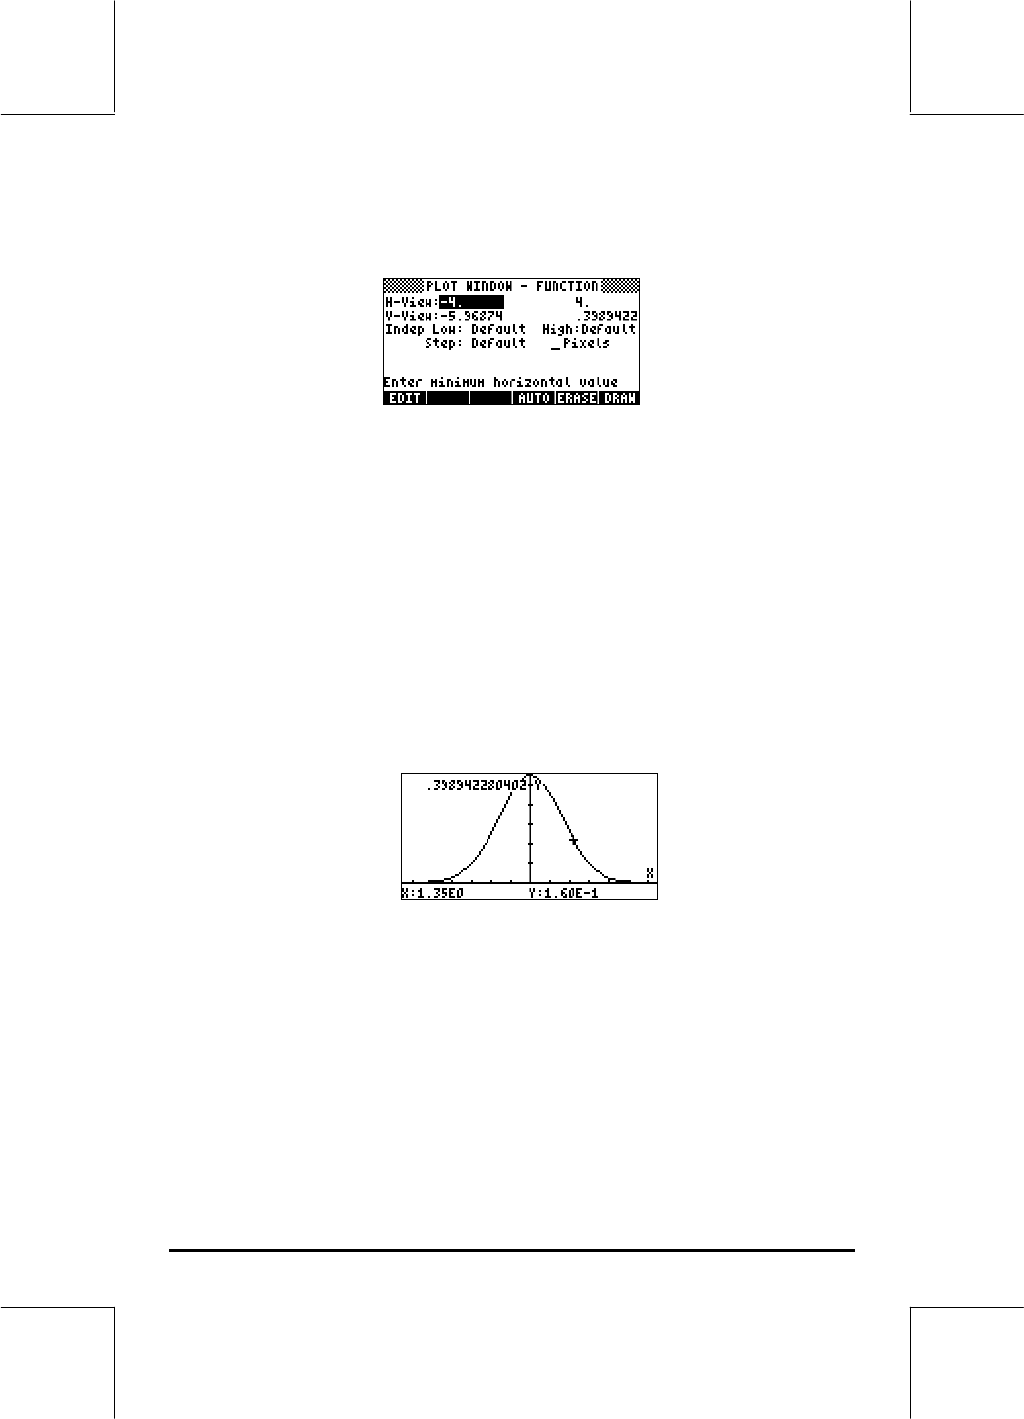
PLOT WINDOW screen looks as follows:
• Plot the graph: @ERASE @DRAW (wait till the calculator finishes the
graphs)
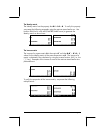
• To see labels: @EDIT L @LABEL @MENU
• To recover the first graphics menu: LL@)PICT
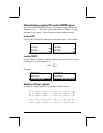
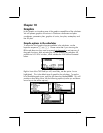
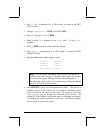
• To trace the curve: @TRACE @@X,Y@@ . Then use the right- and left-arrow
keys (š™) to move about the curve. The coordinates of the points
you trace will be shown at the bottom of the screen. Check that for x
= 1.05 , y = 0.0231. Also, check that for x = -1.48 , y = 0.134.
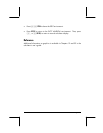
Here is picture of the graph in tracing mode:
• To recover the menu, and return to the PLOT WINDOW environment,
press L@CANCL. Press L@@OK@@ to return to normal display.
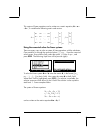
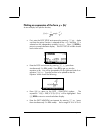
Generating a table of values for a function
The combinations „õ(E) and „ö(F), pressed simultaneously
if in RPN mode, let’s the user produce a table of values of functions. For
example, we will produce a table of the function Y(X) = X/(X+10), in the
range -5 < X < 5 following these instructions: