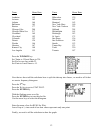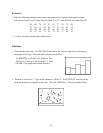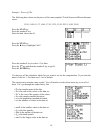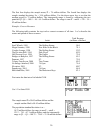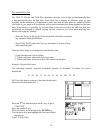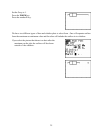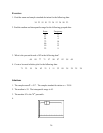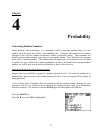
The first line displays the sample mean, Ë = 78 million dollars. The fourth line displays the
sample standard deviation, Sx = 34.4 million dollars. Use the down arrow key to see that the
median payroll is 75 million dollars. The interquartile range is found by subtracting the two
quartiles Q3−Q1 = 109.5 − 48 = 61.5 million dollars. The range is maxX − minX = 126 − 34 =
92 million dollars.
Example: Concert Revenues
The following table contains the top twelve concert revenues of all time. Let’s describe the
center and spread of these revenues.
Total Revenue
Tour Artist (millions of dollars)____
Steel Wheels, 1989 The Rolling Stones 98.0
Magic Summer, 1990 New Kids on the Block 74.1
Voodoo Lounge, 1994 The Rolling Stones 121.2
The Division Bell, 1994 Pink Floyd 103.5
Hell Freezes Over, 1994 The Eagles 79.4
Bridges to Babylon, 1997 The Rolling Stones 89.3
Popmart, 1997 U2 79.9
Twenty-Four Seven, 2000 Tina Turner 80.2
No Strings Attached, 2000 ‘N-Sync 76.4
Elevation, 2001 U2 109.7
Popodyssey, 2001 ‘N-Sync 86.8
Black and Blue, 2001 The Backstreet Boys 82.1
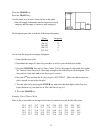
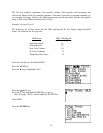
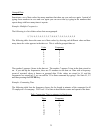
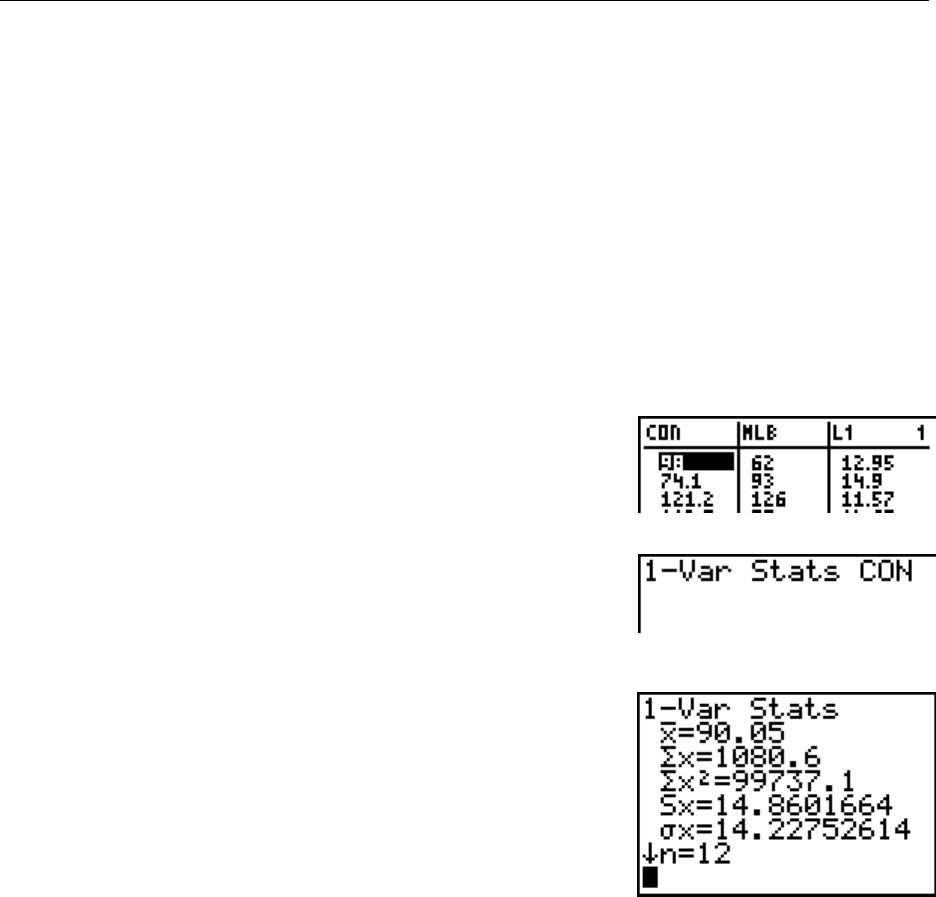
First enter the data into a list labeled CON.
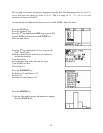
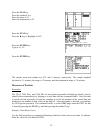
Use 1-Var Stats CON.
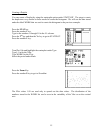
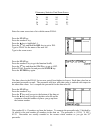
The sample mean Ë is 90.05 million dollars and the
sample median Med is 84.45 million dollars.
The population standard deviation is σ =
14.23 million dollars, the range is maxX − minX =
121.2 − 74.1 = 47.1 million dollars, and the interquartile
range is Q3 − Q1 = 100.75 − 79.65 = 21.10 million dollars.
20


