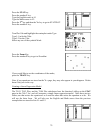
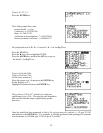
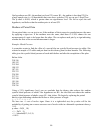
Our hypotheses are H0 : the median is at least $70 versus H1 : the median is less than $70. For
a large sample size (n = 89 households that were above or below $70) we can use 1-PropZTest.
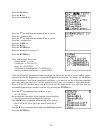
The p-value is 0.084, which is greater than our significance level. We fail to reject the null
hypothesis, and believe that the median price is at least $70.
Medians of Paired Data
Given paired data, we can test to see if the medians of their respective populations are the same
by applying a signs test. If the medians were the same, then there if a 50% chance for one
measurement of a pair to be larger than the other. We can replace each pair by a sign indicating
whether the first or the second measurement is larger.
Example: Blood Pressure
A researcher wants to find the effect of a special diet on systolic blood pressure in adults. She
selected a sample of 12 adults and put them on this dietary plan for three months. The following
table gives the systolic blood pressure of each adult before and after the completion of the plan.
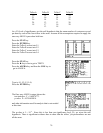
Before After
210 196
185 192
215 204
198 193
187 181
225 233
234 208
217 211
212 190
191 186
226 218
238 236
Using a 2.5% significance level, can we conclude that the dietary plan reduces the median
systolic blood pressure of adults? Our hypotheses are H0 : the diet does not reduce the median
systolic blood pressure of adults versus H1 : that it does. We begin by replacing the paired
data by signs indicating whether the Before or After pressure is larger:
+ − + + + − + + + + ++
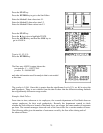
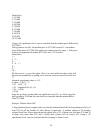
We have ten +’s out of twelve signs. Since it is a right-tailed test, the p-value will be the
probability of getting ten or more successes out of twelve trials in a binomial experiment where p
= 0.5.
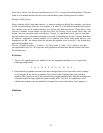
p-value = Pr(X _ 10)
= 1 − Pr(X _ 9)
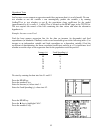
= 1 − binomcdf(12, 0.5, 9)
= 0.019
86


