Teller A Teller B Teller C Teller D
19 14 11 24
21 16 14 19
26 14 21 21
24 13 13 26
18 17 16 20
13 18
At a 5% level of significance, test the null hypothesis that the mean number of customers served
per hour by each of the four tellers is the same. Assume all the assumptions required to apply the
one-way ANOVA procedure hold true.
Press the STAT key.
Press the ENTER key.
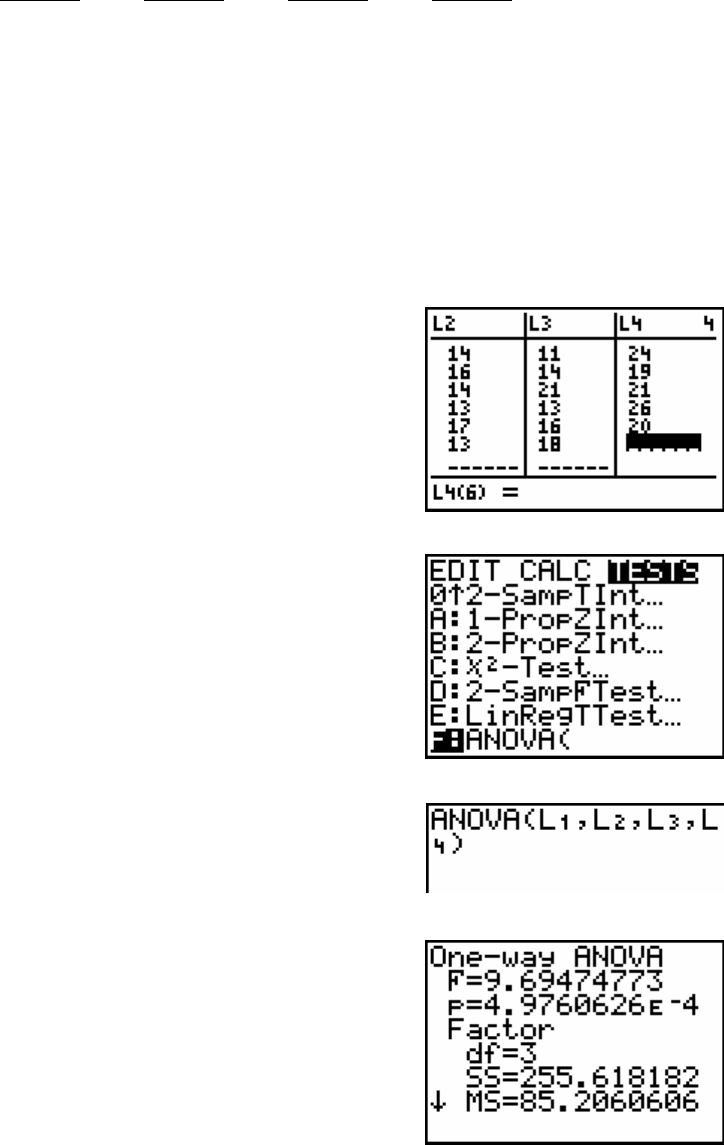
Enter the Teller A scores into L1.
Enter the Teller B scores into L2.
Enter the Teller C scores into L3.
Enter the Teller D scores into L4.
Press the STAT key.
Press the ► key twice to get to TESTS.
Press the ALPHA key and then the COS key to
get to ANOVA.
Type in L1, L2, L3, L4).
Press the ENTER key.
The One-way ANOVA output shows the:
test statistics: F = 9.69474773
p-value: P= 4.9760626E-4
and other information used for analysis that is not needed
at this time.
The p-value is 5 × 10
−4
. Since this is less than our significance level 5%, we reject the null
hypothesis. There is significant evidence here to show that the tellers’ job performances are not
all the same.
76
