Exercises
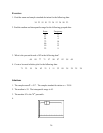
1. Find the mean and sample standard deviation for the following data:
34 23 55 91 23 34 12 34 98 23
2. Find the median and interquartile range for the following grouped data:
Score Frequency
34 9
27 11
84 4
72 14
86 8
59 12
22 9
3. What is the percentile rank of 82 in the following data?
68 89 77 71 57 90 97 82 58 69
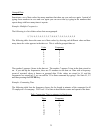
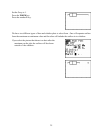
4. Create a box-and-whisker plot for the following data:
71 23 19 34 42 21 5 11 32 89 38 39 25 24
Solutions
1. The sample mean Ë = 42.7. The sample standard deviation sx = 29.58.
2. The median is 59. The interquartile range is 45.
3. The number 82 is the 70
th
percentile.
4.
26


