Chapter
10
Estimation and Hypothesis
Testing: Two Populations
Confidence Interval for µ1 − µ2
If you are fortunate enough to have information about the population standard deviations, you
can use 2-SampZInt to estimate the difference µ1 − µ2 between two population means.
The most general approach, though, to estimating the difference of two population means is to
compute a T-based confidence interval, which does not make any assumptions about the
population’s standard deviations. This is provided on the calculator by the function 2-SampTInt.
Both of the interval functions are located on the STAT page in the TESTS list.
Example: Average Salaries
According to the U.S. Bureau of the Census, the average annual salary of fulltime state
employees was $49,056 in New York and $46,800 in Massachusetts in 2001. Suppose that these
mean salaries are based on random samples of 500 full-time state employees from New York and
400 full-time state employees from Massachusetts and that the population standard deviations of
the 2001 salaries of all full-time state employees in these two states were $9000 and $8500,
respectively. Construct a 95% confidence interval for the difference in 2001 mean salaries
between the two states.
Let New York employees be Population no.1 and Massachusetts employees be Population no.2.
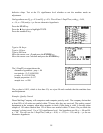
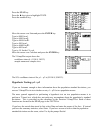
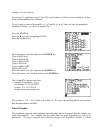
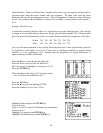
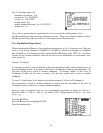
We are given the population standard deviations, so we will use 2-SampZInt with Stats selected.
We set σ
1
= 9000, σ
2
= 8500, Ë
1
= 49,056, n
1
= 500, Ë
2
= 46,800, n
2
= 400, and our C-Level at
0.95.
61


