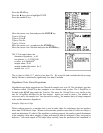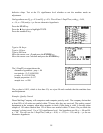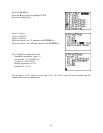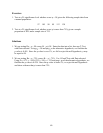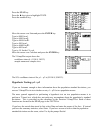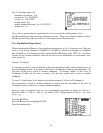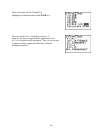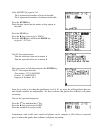
The T-Test output shows the:
alternative hypothesis: µ>0
test statistic: t=1.226498265
p-value: p=.1329778401
sample mean: Ë=5
sample standard deviation: Sx=10.78579312
sample size: n=7
The p-value is greater than the significance level so we accept the null hypothesis of no
significant difference between the pre and posttest scores. There is not enough evidence to claim
that the special dietary plan was effective in lowering systolic blood pressure.
Two Population Proportions
When estimating the difference of two population proportions, p1−p2, or testing to see if they are
equal, we can use the functions 2-PropZInt or 2-PropZTest, which are analogous to 1-PropZInt
and 1-PropZTest. The functions are also located on the STAT page in the TEST list. As before,
in order to use Z-based confidence intervals and tests for two populations we need sample sizes
to be at least 30.
Example: Toothpaste
A researcher wanted to test for differences between toothpaste loyalty when comparing two of
the top toothpaste brands. In a sample of 500 users of Toothpaste A taken by this researcher, 100
said they would never switch to another toothpaste. In another sample of 400 users of
Toothpaste B taken by the same researcher, 68 said they would never switch to another
toothpaste.
Test at a 1% significance level whether or not the percentage of all users of Toothpaste A
who would never switch to another toothpaste is higher than the percentage of all users of
Toothpaste B who would never switch to another toothpaste.
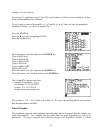
Since we want a hypothesis test to see if two population proportions are equal, we will use 2-
PropZTest with x
1
= 100, n
1
= 500, x
2
= 68, and n
2
= 400. Our hypotheses are H
0
: p
1
= p
2
versus
H
1
: p
1
> p
2
.
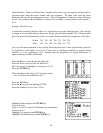
Press the STAT key.
Press the ► key twice to highlight TESTS.
Press the number 6 key.
65


