


Switch Management Tools
8946121602 1-3
• Interfaces
— In-band over a Fibre Channel link
— Out-of-band through a 10Base-T Ethernet connection
Switch Management Tools
The management tools provide five screens as described below.
Fabric View Page
The Fabric View page shows the number of network switches and confirms World Wide
Names, domain IDs, and switch names, if applicable.
Fabric Topology View Page
The Fabric Topology View page shows the physical configuration including active domains,
paths and routing information. For example, this page shows the hop count. Hop count is the
number of switches that handle a data frame from origination to the destination.
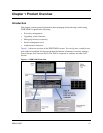
General Switch View Page
The General Switch View page displays switch enclosure information, confirms general
switch information, and includes GUI buttons for quick access to the Administrative Interface,
Telnet, and the Performance View pages.
The front panel identifies the type of interface module installed in each switch slot, the
industry media (GBIC, or Gigabit Interface Converter) used by the ports, and each port’s LED
status. From this view, more information is available about the switch by moving to either the
Performance View or the Port Detail View pages.
Performance View Page
The Performance View page shows real-time data throughput for each port and switch
bandwidth utilization.
Two types of performance data are available. They are: (1) the throughput of each port, and (2)
total switch throughput. Bandwidth utilization is critical information needed to make decisions
about optimizing performance. An example of a bandwidth utilization decision is if one port
begins to handle a disproportionate amount of traffic.