Performance View Page
8946121602 3-9
Performance View Page
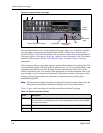
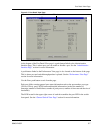
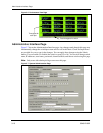
Figure 3-6 shows the Performance View page. This page displays port and switch throughput
(in bytes per second). The first 16 graphs show the port throughput for port number 0 through
15. Throughput for the entire switch displays in the long rectangular graph at the bottom.
Notes: Horizontal axis represents time elapsed. The port throughput graphs hold up to 60
seconds of performance data. The switch throughput graph at the bottom holds up to
four minutes of performance data.
Vertical axis in each graph shows throughput (in bytes per second). It is
automatically scaled depending on the switch activity. The display is updated
roughly once per second.
The total throughput value is the throughput sum for all ports. The throughput number
represents the number of bytes received plus the number of bytes transmitted each second.
Note: Because the switch also transmits all data it receives, the total throughput for the
switch could, alternately, be stated as one-half (1/2) of the throughput sum of all ports.
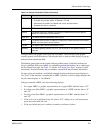
Frjt Number of Frame rejected.
Fbsy Number of frames busy.
Link_Failure Number of link failure.
Loss_of_sync Loss of synchronization.
Protocol_err Protocol error.
Invalid_word Invalid word (encoding errors inside of frames).
Invalid_crc Invalid CRC in a frame.
Delim_err Delimeter error (order set)
Address_err Address id error (S_ID D_ID)
Lr_in Link reset in (primitive sequence). Does not apply to FL_Port.
Lr_out Link reset out (primitive sequence). Does not apply to FL_Port.
Ols_in Offline resent in (primitive sequence). Does not apply to FL_Port.
Ols_out Offline resent in (primitive sequence). Does not apply to FL_Port.
Table 3-4 Port Detail View Page Fields (Continued)
Field Description


