SES Functional Model
2-2 8946121402
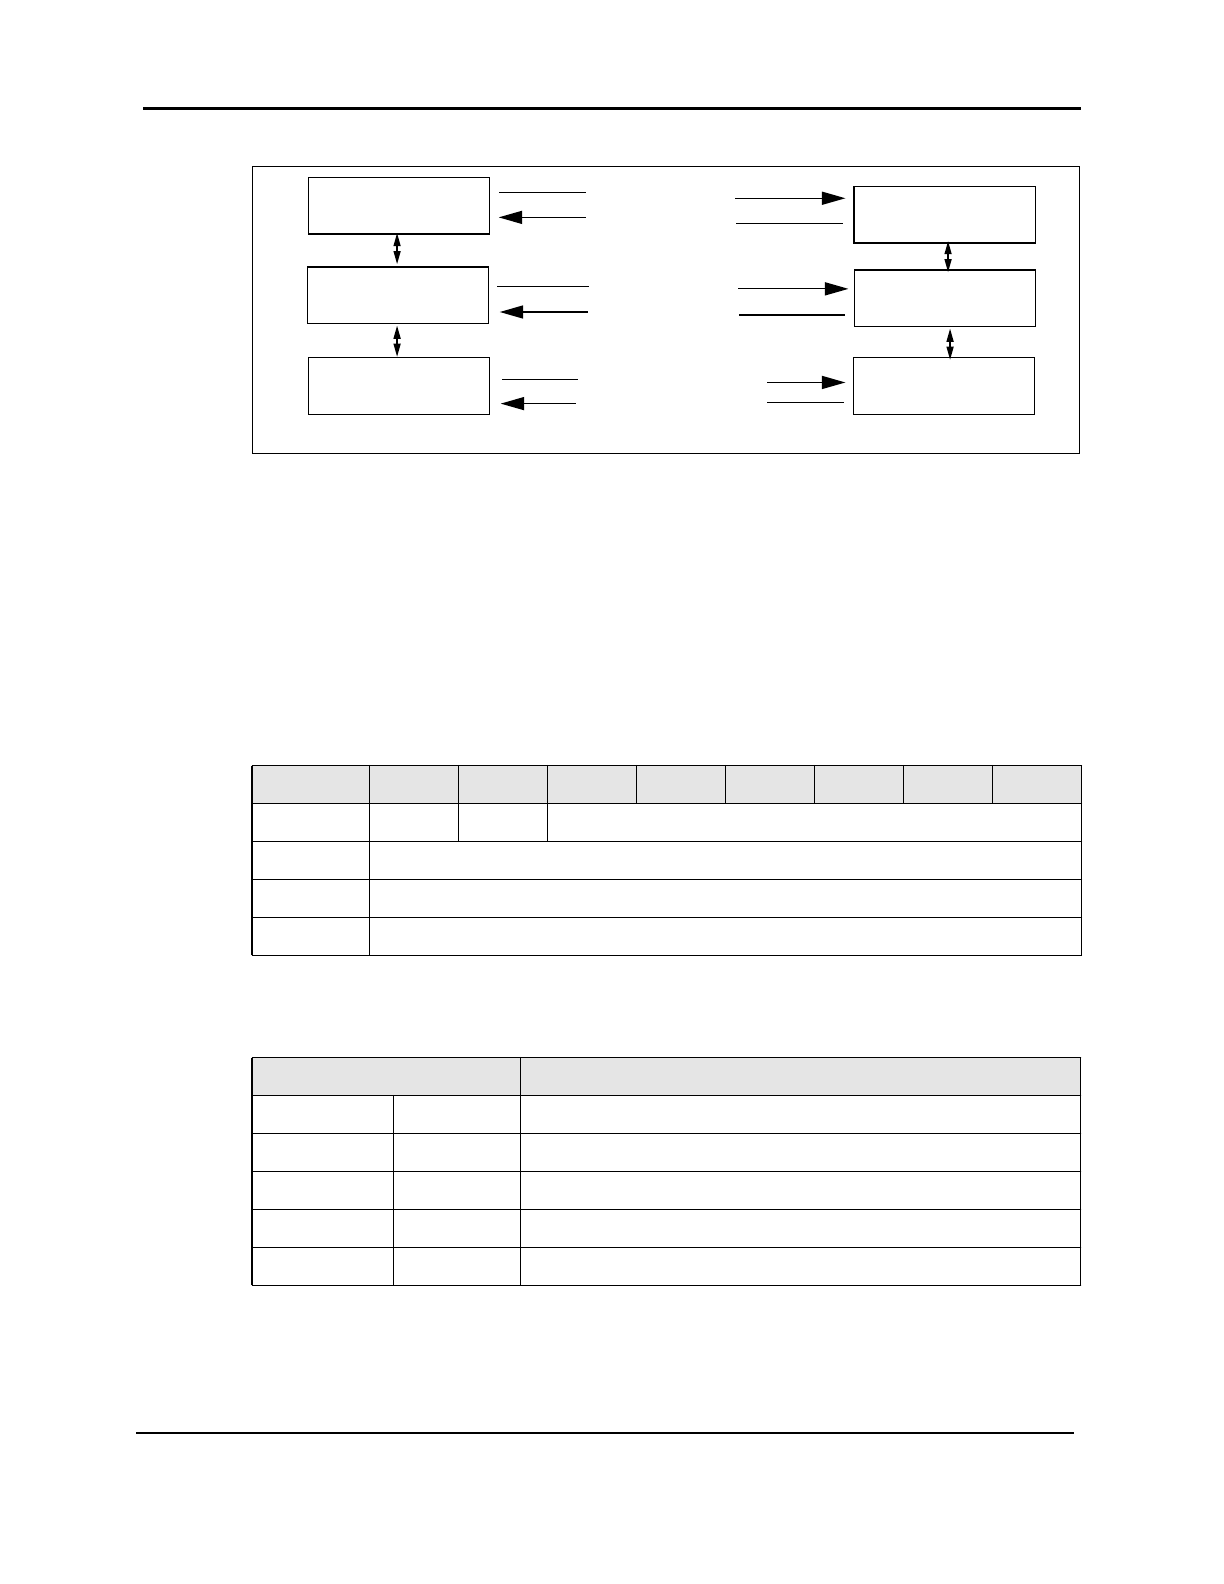
Figure 2-2 SES Functional Model
At the Fibre Channel level, each SESD is accessible through the Fibre Channel well known
address,
FFFFFAh (Management Server). At the SCSI-3 level, it is associated with a LUN. An
SES Application Client can refer to any distributed SESD within the Fabric using its LUN. A
LUN value of 0 is always associated with the local switch that is physically attached to the
SES Application Client. The unique LUN value is mapped based on peripheral device
addressing.
The bus number for each switch is set to
010000b as shown in Table 2-1. The first byte of the
Target/LUN is set using the
Domain_ID of the switch. Bytes 2..7 are set to zero.
Table 2-2 shows the LUN mapping.
Table 2-1 Format of LUN recognized by SESD
Byte/Bit 7 6 5 4 3 2 1 0
0 0 0 Bus Number = 010000b
1 Target
... or
7 Logical Unit Number (LUN)
Table 2-2 LUN Mapping
Domain ID Unique LUN Value (in Hex)
0 0h 01000000 00000000
5 5h 01050000 00000000
12 Ch 010C0000 00000000
15 Eh 010F0000 00000000
25 19h 01190000 00000000
SES Application
Client
FCP Port
FC-PH
SES Device
FCP _Port
FC-PH
FCP Command
FCP Response
SES Response
SES Request
Response Sequence
Request Sequence


