20 Getting Started
The importance of mode settings
Example: Multiply 2/3 Q 2.
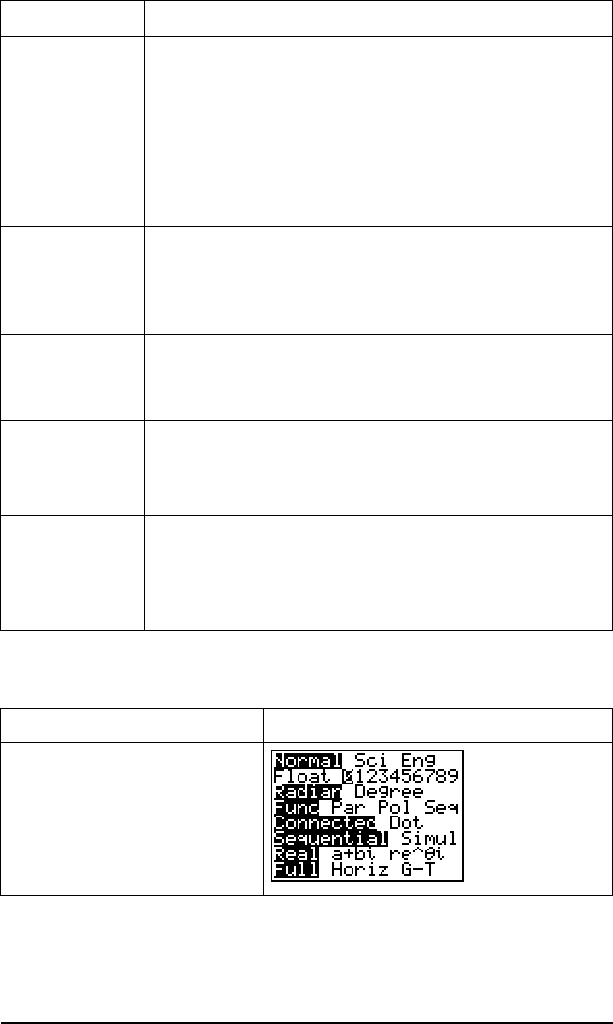
Type of graph
•
Func (functional): plots functions, where Y is a
function of X
•
Par (parametric): plots relations, where X and Y
are functions of T
•
Pol (polar): plots functions, where r is a function
of ô
q
•
Seq (sequence): plots sequences
Plot type
•
Connected: draws a line connecting each point
calculated for the selected functions
•
Dot: plots only the calculated points of the
selected functions
Sequential or
simultaneous
graphing
•
Sequential: draws graphs one at a time
•
Simul (simultaneous): draws several graphs at the
same time
Real or
complex mode
•
Real:
displays real numbers, such as 1, 1/2, ‡3
•
a+b× (rectangular complex): displays as 3+2×
•
re^q× (polar complex): displays as re^q×
Screen display
•
Full: displays full screen
•
Horiz: displays a horizontal split screen
•
G-T: displays a vertical split screen (graph &
table)
Press Result
z † ~ Í
Setting Choices


