


Chapter 8 Performance
NetAtlas Workgroup User’s Guide
99
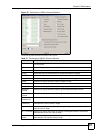
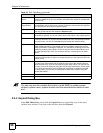
You may also edit the color code and line style for a variable in the dialog box as described in
the following table.
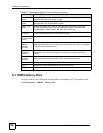
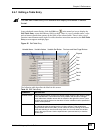
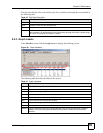
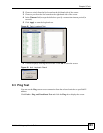
8.5.3 Graph Labels
In the Interface screen click the Graph button to display the following screen.
Figure 60 Graph Variables
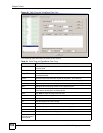
The following table describes the labels in this screen.
Table 42 Edit Style Dialog Box
FIELD DESCRIPTION
Display Check Display to view information about this variable in chart format.
Color Choose a color from this drop down list.
Style Choose a line style from this drop down list.
Scale Select the scaling multiplier from this drop down list. This factor is applied to each value in
the line before it is displayed and can be used to keep all graph lines within a similar range
of values. The range is from 0.0001 to 1000.0.
Table 43 Graph Variables
LABEL DESCRIPTION
Style This is the line style discussed above.
Variable This is the variable being represented by the line style discussed above.
Scale This is the scaling multiplier.
Cur This is the current value of the variable.
Min This is the minimum value of the variable.
Max This is the maximum value of the variable.
Ave This is the average value of the variable.
Total This is the total value of the variable.
Baseline This is a measure of the typical variable behavior. After a learning period has transpired,
SNMPc can automatically generate baseline alarms when variable values exceed the
baseline.