


GigaX Series L3 Managed Switch User Guide
75
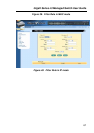
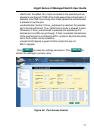
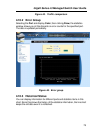
Figure 45. Traffic comparison
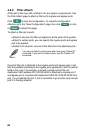
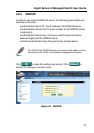
4.10.2 Error Group
Selecting the Port and display Color, then clicking Draw, the statistics
window shows you all the discards or error counts for the specified port.
The data is updated periodically.
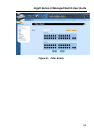
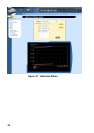
Figure 46. Error group
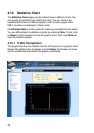
4.10.3 Historical Status
You can display information for different ports and statistics items in this
chart. Since this shows the history of the statistics information, the line chart
keeps the old data even it is refreshed.