


Bridging
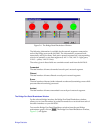
5-8 Bridge Statistics
Filtered (Magenta)
Filtered The total number of frames filtered by the bridge, at the device or
port level.
Nothing The Filtered scale is not currently measuring the number of
packets filtered by the bridge.
Total Errors (Red)
Total Errors The total number of errors experienced by all bridging interfaces
on the selected module, or by an individual bridge interface.
Nothing The Errors scale is currently not measuring error packets coming
through the device as a whole or a single port.
Xmitted (Blue)
Xmitted The total number of frames transmitted by the selected bridge
interface, or by all bridge interfaces.
Nothing The Xmitted scale is not currently measuring the number of
packets filtered by the bridge or the selected individual interface.
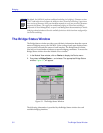
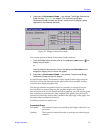
Configuring the Bridge Performance Graphs
To configure the Bridge Performance Graph:
1. Using the mouse, click on (with green statistics to the right). The
Forwarded menu will appear. Click on the desired mode.
2. Click on (with magenta statistics to the right). The Filtered menu
will appear. Click on the desired mode.
3. Click on (with red statistics to the right). The Errors menu will
appear. Click on the desired mode.
4. Click on (with blue statistics to the right). The Xmitted menu will
appear. Click on the desired mode.
Once you have selected a new mode, it will appear in its respective button, and
after the next poll the Performance Graph will refresh and begin to measure using
the new mode.
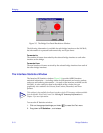
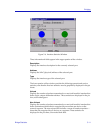
The Bridge Detail Breakdown Window
The Bridge Detail Breakdown window allows you to compare the number of
frames forwarded, filtered, and transmitted on the network segments connected
to each bridging interface on your 9A128-01, as well as the number of errors
experienced on each interface.
To access this window from the Bridge performance graph, click on . The
Bridge Detail Breakdown window, Figure 5-4, will appear.