


Bridge Statistics 5-9
Bridging
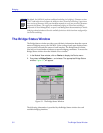
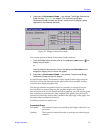
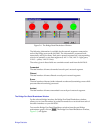
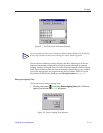
Figure 5-4. The Bridge Detail Breakdown Window
The following information is available for the network segments connected to
each of the bridge ports on the 9A128-01. The information is expressed both
numerically and in pie charts. Each port’s network segment has a corresponding
color for its statistics or pie chart segments (LAN 1 = red, LAN 2 = light green,
LAN 3 = yellow, LAN 4 = blue).
The values given in these fields are cumulative totals read from the 9A128-01.
Forwarded
The total number of frames forwarded on each port’s network segment.
Filtered
The total number of frames filtered on each port’s network segment.
Errors
The total number of frames (either inbound or outbound) containing errors which
prevented them from being processed.
Xmitted
The total number of frames transmitted over each port’s network segment.
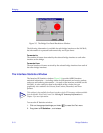
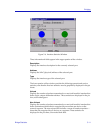
The Bridge Port Detail Breakdown Window
For the selected bridge interface, the Bridge Port Detail Breakdown window
allows you to view the number of packets forwarded to or received from each of
the other interfaces on your 9A128-01.
To access the Bridge Port Detail Breakdown window from the port Bridge
performance graph, click on . The Bridge Port Detail Breakdown window,
Figure 5-5, will appear.