


5-13
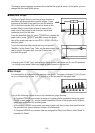
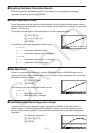
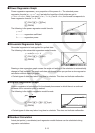
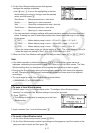
k Power Regression Graph
Power regression expresses y as a proportion of the power of x. The standard power
regression formula is y = a × x
b
, so if we take the logarithm of both sides we get In
y = In a + b × In x. Next, if we say X = In x, Y = In y, and A = In a, the formula corresponds to
linear regression formula Y = A + bX.
1(CALC)6(g)4(Pwr)
6(DRAW)
The following is the power regression model formula.
y = a·x
b
a ..............regression coefficient
b ..............regression power
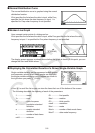
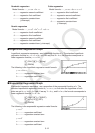
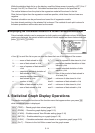
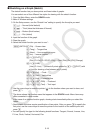
k Sinusoidal Regression Graph
Sinusoidal regression is best applied for cyclical data.
The following is the sinusoidal regression model formula.
y = a·sin(bx + c) + d
1(CALC)6(g)5(Sin)
6(DRAW)
Drawing a sine regression graph causes the angle unit setting of the calculator to automatically
change to Rad (radians). The angle unit does not change when you perform a sine regression
calculation without drawing a graph.
• Certain types of data may take a long time to calculate. This does not indicate malfunction.
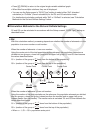
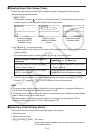
k Logistic Regression Graph
Logistic regression is best applied for time-based phenomena in which there is a continual
increase until a saturation point is reached.
The following is the logistic regression model formula.
1(CALC)6(g)6(g)1(Lgst)
6(DRAW)
• Certain types of data may take a long time to calculate. This does not indicate malfunction.
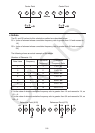
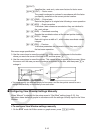
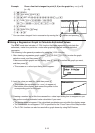
k Residual Calculation
Actual plot points ( y-coordinates) and regression model distance can be calculated during
regression calculations.
y =
c
1 + ae
–bx
y =
c
1 + ae
–bx