


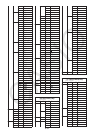

6-28
• Descending order
3
SortD ( List 1, List 2, List 3 )
Lists to be sorted (up to six can be specified)
3
432
k Using Statistical Calculations and Graphs in a Program
Including statistical calculations and graphing operations in a program lets you calculate and
graph statistical data.
u To set conditions and draw a statistical graph
Following a StatGraph command (“S-Gph1”, “S-Gph2”, or “S-Gph3”), you must specify the
following graph conditions:
• Graph draw/non-draw status (DrawOn/DrawOff)
• Graph Type
•
x-axis data location (list name)
•
y-axis data location (list name)
• Frequency data location (list name)
• Mark Type
• Pie graph display setting (% or Data)
• Pie graph percentage data storage list specification (None or list name)
• First bar graph data (list name)
• Second and third bar graph data (list name)
• Bar graph orientation (Length or Horizontal)
The graph conditions that are required depends on the graph type. See “Changing Graph
Parameters” (page 5-1).
• The following is a typical graph condition specification for a scatter diagram or
xy line graph.
S-Gph1 DrawOn, Scatter, List 1, List 2, 1, Square _
In the case of an
xy line graph, replace “Scatter” in the above specification with “ xyLine”.
• The following is a typical graph condition specification for a normal probability plot.
S-Gph1 DrawOn, NPPlot, List 1, Square _
• The following is a typical graph condition specification for a single-variable graph.
S-Gph1 DrawOn, Hist, List 1, List 2 _
The same format can be used for the following types of graphs, by simply replacing “Hist” in
the above specification with the applicable graph type.
Histogram ....................... Hist Normal Distribution ............. N-Dist
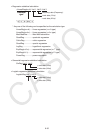
Median Box .................... MedBox*
1
Broken Line .........................Broken
*
1
Outliers:On Outliers:Off
S-Gph1 DrawOn, MedBox, List 1, 1, 1 S-Gph1 DrawOn, MedBox, List 1, 1, 0