


SK-91F467-FLEXRAY V1.1
Getting Started
© Fujitsu Microelectronics Europe GmbH - 57 - FMEMCU-UG-910017-11
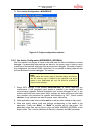
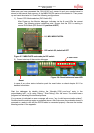
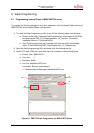
The memory window can be very helpful to check the registers or the frame memory of the
connected graphic controller !
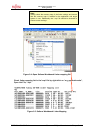
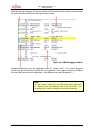
DISASSEMBLER: Disassembles the content of the code memory beginning from
actual PC position and displays the result in a separate window. Individual
assembler-lines can be changed using the „inline assemble“-function.
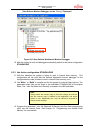
DEBUG - STACK: Displays the current stack contents in terms of function calls.
Parameters, if any, are displayed in brackets.
DEBUG - VECTOR: Reads out and displays the actual interrupt-vector table. Use the „jump“
function to display any code areas pointed to by an interrupt vector (e.g. interrupt service
routines used in your program).
DEBUG - CALL: This function can be used to „call“ any routine defined in your code when
the debugger is on hold.
DEBUG – LOAD TARGET FILE: Starts a new download of the current load module (ABS
file). Usually this function will be executed automatically after starting the debugger (defined
in debug settings ; see „Project-Setup-Debug“). However, this function can be useful to re-
initialize the debugger for the current debug session.
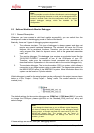
VIEW - SYMBOL: This function displays all (global) symbols of the current project.
Information about the type (char, integer etc.) and the location (address in RAM or register)
can be shown using „detail“.
VIEW - LOCAL: Similar to View-Symbol, but only local variables of the current function are
shown.
VIEW - COMMAND: From this window, the debugger can be controlled using a command
line input. All GUI functions are available as individual commands.
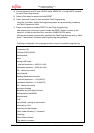
Example:
Run continuously
Step
Examine PDRG
Set break main
Dump/Halfword 0x2000000..0x20000FF
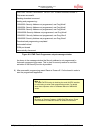
Shortcuts to complex commands can be defined (“alias”) and parameter strings can be
substituted by variables.
Example: mydump = Dump/Halfword 2000000..20000ff