


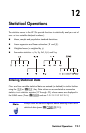

12-6 Statistical Operations
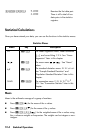
Sample Standard Deviation
Sample standard deviation is a measure of how dispersed the data values are
about the mean sample standard deviation assumes the data is a sampling of a
larger, complete set of data, and is calculated using n – 1 as a divisor.
Press
() for the standard deviation of x–values.
Press
Õ () for the standard deviation of y–values.
The (σ) and (σ) items in this menu are described in the next section, "Population
Standard Deviation."
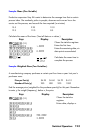
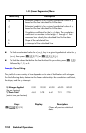
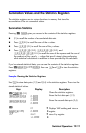
Example: Sample Standard Deviation.
Using the same process–times as in the above "mean" example, May Kitt now
wants to determine the standard deviation time (s
x
) of the process:
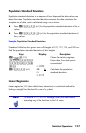
Calculate the standard deviation of the times. (Treat all the data as x–values.)
Four data pairs
accumulated.
ÕÕ ()
Calculates the mean price
weighted for the quantity
purchased.
15.5 9.25 10.0
12.5 12.0 8.5
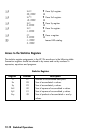
Keys: Display: Description:
()
Clears the statistics registers.
Enters the first time.
Enters the remaining data; six
data points entered.
()
Calculates the standard deviation
time.