


11 http://www.national.com
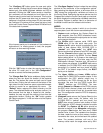
** From the Windows Start Programs menu,
launch
the Capture program
(it’s inside the
C:\nsc
folder).
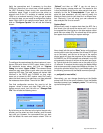
Right click inside the Control Panel and select
Configure I/O
and click the appropriate PC COM
port button. Next, right click inside the Control Panel
and select
Configure Capture
. Select the following
options:
Mode = Capture; Bits =24; Channel = A;
From = AOUT; 1st Bit = Capture 1st Bit; Phase =
In Phase Only
. Click
“OK”
and then click the
Start
button in the Control Panel to start the data capture.
The progress bar should conclude in about 10 seconds.
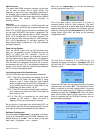
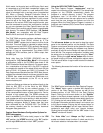
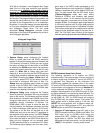
** Launch Matlab. Use the Matlab path browser to
include the analysis Mfiles. The installed default
path is: “c:\nsc\mfiles”. Add this to the Matlab paths,
save the directory file and exit the path browser. At
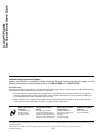
the Matlab command line enter “analysis_menu”. A
GUI will appear. Left click on the
DRCS_Serial
but-
ton to perform an FFT on the captured data.
The menu disappears while the analysis routine is
running. The process takes 4 - 5 seconds on a 133MHz
PC and plots the results when finished.
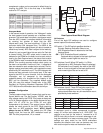
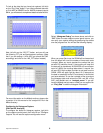
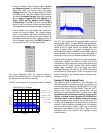
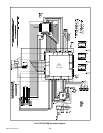
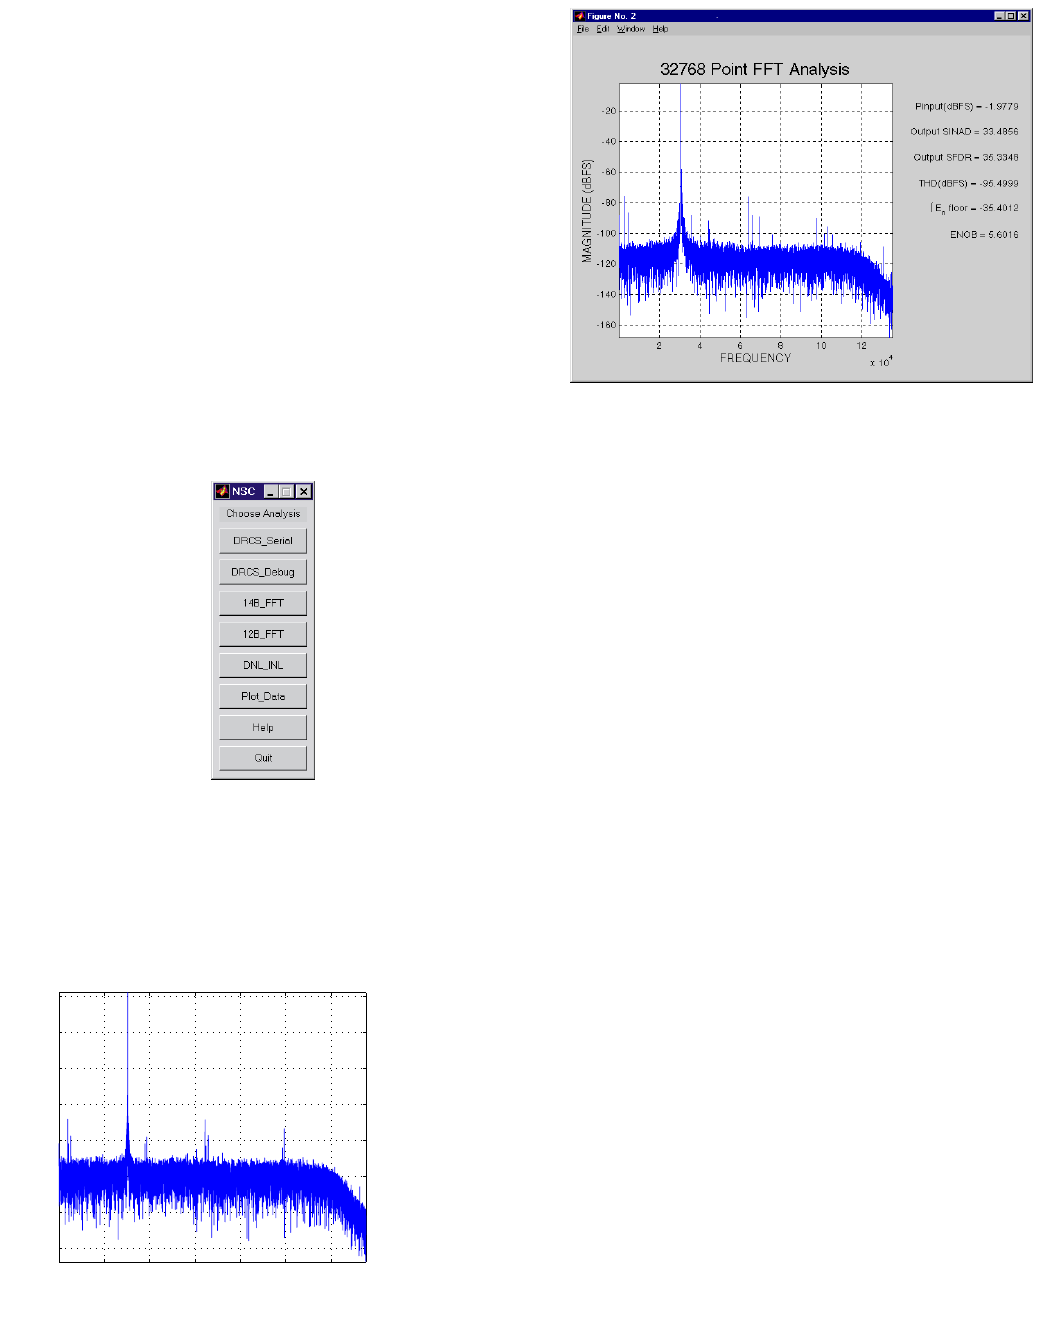
The FFT should report an input power of about -18dBFS.
The FFT plot above and the analysis results highlight
several setup issues. The poor SINAD (and correspond-
ing ENOB) is due to phase jitter (spec’d as SSB Phase
Noise) of the IF signal source (an HP8656 was used
here). A better choice of signal synthesizer is the
HP8644B, which yields a SINAD of about 60dB under the
same conditions. The main portion of the noise power is
contained in the carrier’s immediate sidebands (±5KHz).
Another point of interest is that there are several spectral
lines about -75dBFS and 25KHz on either side of the
fundamental. These have been traced to the ground loop
created by the PC serial interface. Both serial interface
cables were connected while this data was being
collected. Removing the cable to the DRCS will reduce
the amplitude of these spurs. Some of the ground loop
remains because of the required Capture Board’s serial
interface to the PC.
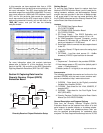
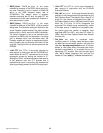
Section IV. Data Analysis Tools
The Matlab scripts contained on the Evaluation Kit
CDROM provide a convenient toolset for evaluation of
National’s Diversity Receiver ChipSet (DRCS) and high
speed ADCs like the CLC595x family. There are 4 FFT
routines and 1 Sine Histogram routine which can be
called from a user interface menu, “analysis_menu”. Set
the Matlab path and working directory to that of the
“Mfiles” provided on the Evaluation Kit CDROM. Run
“analysis_menu” from the Matlab command window
to open a graphical user interface. Each of the called FFT
routines has its appropriate variables set prior to the data
analysis. These variables are explained in the adjacent
text and can be easily edited to adjust for a particular
application from Matlab’s script editor. There are also
comments within the routines that highlight various
analysis blocks.
2 4 6 8 10 12
x 10
4
-160
-140
-120
-100
-80
-60
-40
-20
Frequency
Magnitude (dBFS)
32768 Point FFT Analysis
Pinput (dBFS) = -18.1087
Output SINAD = 51.7058
Output SFDR = 56.0663
THD (dBFS) = -100.7444
∫ E
n
floor = -69.448
ENOB = 11.302